What could be the upcoming amendments to the Environment Protection Act, 1986?

RTI PAPERS RECEIVED FROM ENVIRONMENT MINISTRY INDICATE LEVYING OF MONETARY PENALTIES FOR ENVIRONMENTAL DAMAGE
ENVIRONMENTAL JUSTICE RIGHTS

The CPR-Namati team recently received documents related to the proposed amendments to the Environment Protection Act, (EPA) 1986 following a year-long follow up through the Right to Information (RTI) process. The environment ministry has shared information only up to July 2016, indicating that the other documents are with the Law Ministry, undergoing scrutiny.

This information includes two detailed versions of the proposed amendments and note sheets related to the process of drafting the amendments – carried out between August, 2014 and July, 2016.

On 07.10.2015, the Ministry of Environment, Forests and Climate Change (MoEFCC) had made public the Environment Law (Amendment) Bill, (ELAB) 2015, inviting comments. The CPR-Namati Environmental Justice team made a submission to the MoEFCC when the ELAB was put out in public domain. Manju Menon and Kanchi Kohli discuss some of their arguments in this 2015 article in The Wire.

The documents received indicate that the 2016 version of the ELAB proposed to amend the existing EPA, 1986 by introducing monetary penalties for violations. The environment ministry’s justification is that the current legal structure in place for the protection of the environment is not effective. It is claimed that ‘available remedies under Section 5 and Section 15 are time consuming and not in the larger public interest because industry units have to shut down even in cases where contraventions are minor and reversible.’

The process for making amendments to the EPA had commenced in August 2014, with the appointment of Shri V K Bhasin, a former Law Secretary, as a consultant. It was following the presentation at the Prime Minister’s Office in September 2015, that the Draft Bill was made accessible to the public in October, 2015. The Bill received around 130 comments and Shri Bhasin was appointed for a second term in November, 2015 to revise the draft based on the comments received.

An analysis of the RTI papers by Debayan Gupta reveals that the October, 2015 version of the ELAB has been substantially altered. The earlier version proposed levying penalties for damage and violations based on the extent of the geographic spread of the damage. It also introduced the concept of spot penalties for minor violations, which caused neither substantial nor non-substantial damage to the environment. The April, 2016 version however has done away with both of the above mentioned aspects.

The key proposals of the 2016 version are:

A set of penalties for certain defaults in the Schedule to the Act, to be decided by the Adjudicating Officer;
Types and grades of environmental pollution specified in sections 14H to 14U, the quantum of which is to be determined by the Adjudicating Authority;
Imposition of a lesser penalty on Micro, Small and Medium industries;
The money collected by way of penalties to be credited to the Consolidated Fund of India;
The government can levy fees for carrying out the functions assigned under the Act.
Unlike the earlier draft Bill, the April 2016 version imposes only two sets of penalties with fixed upper limits. The determination of the actual amount is to be done by either the Adjudicating Officer or the Adjudicating Authority, both of whom are to be appointed by the government. It also does away with the idea of spot violations for minor violations and allows for the imposition of a ‘lesser’ penalty based on the size and turnover of the industry.

The RTI application, filed on 31.06.2016 by Kanchi Kohli asking for details of the process remained pending for a year. It was only on 07.6.2017 that the MoEFCC responded agreeing to provide the information within 15 days (the letter disposing the first appeal can be found here). However, only partial information up to July 2016 has been provided, indicating that the most recent file is under scrutiny by the Law Ministry. The documents provided by the MoEFCC include:

  • File notings from December 2014 to July 2016 (accessible here);
  • The first tentative working draft of the ELAB after 07.10.2015 (accessible here);
  • The third working draft after 07.10.2015 (accessible here)
  • The draft cabinet note dated April 2016 (accessible here)

The CPR-Namati team has analysed this information an article earlier this month in The Wire.

What do Bihar voters want?

NOTES FROM THE FIELD
ELECTION STUDIES POLITICS

Neelanjan Sircar, Ashish Ranjan and Bhanu Joshi share their notes from the field based on extensive travel across Bihar to get a sense of how voters are making up their minds.

A spate of contradictory opinion polls and an aggressive campaign between bitter foes, Nitish Kumar and Narendra Modi, and bonhomie between once bitter foes, Nitish Kumar and Lalu Prasad Yadav, have only served to confuse the situation further in the state.

They have focused on constituencies that went to the polls in the first two phases of the election, and tried to tease out what ‘vikas’ means for the people, and how caste influences their decision.

Read the full field notes here: What do voters want?

‘The Hindu’ carried a shorter piece on 28 October: It’s not about caste or beef, but vikas

What do the responses to the 2018 draft Coastal Regulation Zone (CRZ) notification reveal?

READ THE BLOG SERIES
ENVIRONMENTAL JUSTICE

Ministry of Environment, Forests & Climate Change (MoEFCC) issued the draft Coastal Regulation Zone (CRZ) Notification, 2018 on April 18, 2018. The draft came after yearlong indications that the current CRZ Notification, 2011 will be replaced by a new Marine Coastal Regulation Zone (MCRZ) Notification. The proposed changes to the CRZ regulation drastically alter the original provisions of the notification (Read about the changes proposed in the draft CRZ Notification, 2018 here). The draft was open for public comments till June 17, 2018. During this time the ministry received 471 submissions on the draft. Several of these submissions had multiple representations/ signatures in them. If the number of representations is factored into the comments received on the draft CRZ Notification, 2018, the total number of responses received becomes 1965.

Researchers from the CPR-Namati Environmental Justice Program have analysed these comments to understand that most submissions raise serious objections to the ministry’s proposal. On analysing these responses all together, it was found that of these 1965 responses, 1338 (68%) responses have objected to the finalsation of the draft CRZ Notification 2018. About 23% responses have been in favour of the draft CRZ Notification 2018 (see figure below).

Small percentages of responses have suggested changes or sought clarifications to the CRZ Notification and some are inapplicable due to the responses being in regional languages or concerning issues other than coastal regulation.

Specific comments have been received from coastal citizens, fisher groups, political parties, local institutions, government departments and industry associations. The highlights of these comments are presented below:

Representations from coastal citizens:

More than half (250) of the submissions are from coastal citizens. In these 250 submissions there were 414 additional representations/signatures. So total number of responses from coastal citizens becomes 664. Of these 54% (362) demand that the draft CRZ Notification 2018 should not be pursued by the ministry. 32% (216) are in favour of the draft CRZ Notification 2018.
Of the 216 responses that are in favour of the changes, 207 have even asked for further opening up of the coast for tourism projects, dwellings for locals and commercial constructions among others. Many of these responses are from Goa, Kerala and Maharashtra. While most respondents have only mentioned their names and addresses, a small number have identified themselves as advocates and doctors.
5-7 submissions from Sindhudurg and Malvan in Maharashtra seek clarification on the critically vulnerable area protection for these regions as required by the CRZ Notification 2011. This is especially so because no such special provisions are provided in the 2018 draft.
Comments from local institutions

The local bodies that have sent in their responses are from the states of Goa, Maharashtra, Diu, Karnataka, Kerala and Gujarat.

17 submissions have been received from local institutions that include Gram Panchayats, District Panchayats and Municipalities. Of these 13 have suggested changes in the draft CRZ Notification 2018. Many of these include the suggestion that instead of the proposed No Development Zone (NDZ) of 50 m for thickly populated areas and an NDZ of 200 for thinly populated rural areas, a uniform NDZ of 50 should be applied. In the current CRZ Notification 2011, a uniform NDZ of 200 m has been provided.
Some panchayats have demanded that their villages be turned into urban areas. One has demanded retention of provisions of the current CRZ Notification 2011.
Four submissions from local bodies could not be considered as the ministry noted that they were in regional language.
Responses from the industry

45 responses have been from the sectors of tourism, real estate and construction, mining, ports and harbours and industries. Of these 40 have suggested further dilutions in the draft and two have appreciated the draft. Some of the suggested dilutions are permitting mechanised mining, fish processing plants and storage of chemicals that are allowed to be transported through pipelines and jetties in the CRZ, lifting restriction on land use change for buildings in the CRZ. Remaining three responses have either sought clarifications or sought retention of certain biodiversity protections in the notification.
Submissions from fishing unions and associations

Of 28 fisher groups who have sent in their submissions, 24 have expressed their objections to the draft CRZ Notification 2018. They either ask for the draft to be scrapped or demand continuation of the current provisions. One such submission from Pavity Jinwar Kodi from Mumbai has 120 representations. The submission states that the CRZ Notification 2011 is better than the draft. It demands that the fishers be given importance and no draft should be considered without consulting the fishing community.
These 24 submissions also have 181 additional representations/signatures.
Several submissions suggest that the NDZ in rural areas and around the creeks should not be reduced.
3-4 fisher groups have demanded that CRZ Notification should be turned into an Act.
Comments from government departments

Ten government departments from the state of Maharashtra, one from Kerala, one from Karnataka and two central government departments have also submitted their comments. Of these two didn’t have any specific comments, 11 have sought more dilutions in the draft CRZ Notification 2018. This is with respect to their jurisdictions such as Maharashtra Metro Rail, Urban Development and Mining, Karnataka Tourism, and Coast Guard headquarter. They suggest changes pertaining to approval of buildings according to the local town and country planning norms, metro and allied activities, Indian coastguard stations and associated infrastructure in the CRZ, further reduction of the NDZ and no requirement for maintaining buffer around mangroves on private lands.
Representations from Political Parties

The ministry received six submissions from politicians and political parties. Four are from Daman & Diu offices of Bhartiya Janata Party (BJP), one from a member of parliament from the BJP and one from the Aam Aadmi Party (AAP), Goa. All of them, except AAP have requested for additional easing of the CRZ regulation. The suggested changes relate to further reduction of the NDZ and conversion of rural areas (CRZ III) to urban areas (CRZ II) so they have fewer restrictions for land use change. One submission suggests that mining of all minerals be permitted in water areas of the CRZ.
Besides these, submissions have also been received from academics, researchers, scientific and educational institutions and religions institutions. Find the compilation of comments as received from the MoEFCC here.

Changes to the CRZ Notification, have been under discussion for past four years- a special review by the Shailesh Nayak Committee followed by a series of amendments have been in the news. At CPR, we have continuously brought analysis of the same. For details see here, here and here.

All these efforts of the ministry at altering India’s coastal regulation have been characterised by opacity including a closed-door review and denied opportunities for public comments on amendments. But, such large number of responses on the draft CRZ Notification, 2018 is a reiteration of the fact that coastal regulation is an issue of citizen and public interest.

The above analysis of the comments shows that there is a diversity of viewpoints on the draft. The draft is yet to be finalised and as of October 2018, the MoEFCC had compiled these diverse comments for consideration. While finalising, the ministry is also going to strive to resolve the issues on which a difference of opinion was observed among its officers and ministers and weave those changes in. (Read about those issues here). The lack of consensus within and outside of the ministry is a clear indication that the contentious points of coastal regulation need public engagement larger than what is being practiced currently.

This is part 2 of a blog series on CRZ revamp in making since 2014.

In the third blog post of the series, views of different members from within the ministry and stakeholders from outside on certain contentious issues will be presented.

What does an Indian smart city look like?

FULL VIDEO OF TALK
URBAN ECONOMY URBAN GOVERNANCE URBAN SERVICES

Watch the full video (above) of the talk by Ashwathy Anand, Ajai Sreevatsan, and Persis Taraporevala, where they present their analysis of the accepted smart city proposals and ancillary secondary data.

Given the scale and significance of the mission, the discussion seeks to present an empirical understanding of what India thinks a smart city looks like and examine the potential of achieving its aims of creating more liveable, sustainable and financially secure cities.

Ashwathy Anand is a trained architect from the School of Planning and Architecture, Bhopal; Ajai Sreevatsan is a former investigative reporter with The Hindu; and Persis Taraporevala is a research associate at CPR.

The Q&A session that followed can be accessed here.

What is Different about US Foreign Policy and Diplomacy in the Trump Era?

FULL VIDEO OF THE TALK
INTERNATIONAL POLITICS

Watch the full video above of the talk on ‘What is Different about US Foreign Policy and Diplomacy in the Trump Era?’ featuring Dr Jon P Dorschner.

Professor Jon Dorschner analysed the changes in both the form and content of US foreign policy during the presidency of Donald J Trump and compared and contrasted it with those of the previous administrations. He discussed Trump’s India policy and how it fits into America’s larger South Asia policy (including Afghanistan), and its impact on US diplomacy in the subcontinent.

Dr Jon P Dorschner is a professor of Political Science at the Center for Government and Public Policy, University of Arizona, Tucson.

The question and answer session that followed can be accessed here.

What is happening beyond large cities? Understanding census towns in India

PART 2 OF A SERIES OF INTERPRETATIONS DRAWING ON A NEW BOOK ON SMALL TOWNS


Kanhu Charan Pradhan from CPR, who was among the first scholars to highlight the specific role of Census Towns in the 2001-2011 period, draws on his earlier research to explain the role of census towns in understanding the pattern of urbanisation in India.

How is the ‘urban’ defined in India?

The definition of what is ‘urban’ in India is relatively complex. The UN ‘Demographic Yearbook 2005’, which compiles the various ways in which urban is defined across the world shows that the Indian definition is unique to the country. All urban areas in India can be broadly classified into three groups on the basis of their manner of governance.

  • The first type includes all urban areas that are established under a law, whether it is a state or a central law. These urban areas have a pre-defined structure of urban governance and they are known as ‘statutory towns’ (STs). They are governed by urban local bodies.The STs can be further divided into three groups depending on the nature of laws under which they were established. ‘Cantonment boards’ in India come under the central government and were established under The Cantonment Act, 2006. Urban local bodies were given constitutional status under the 74th amendment to the Constitution of India. States define specific criteria for categorising various types of municipalities, and these often differ from one state to another. Overall, ‘Municipal Corporations’ are instituted for large cities while ‘Municipalities’ cover smaller urban settlements, and ‘Nagar Panchayats’ are set up for transitional areas. However, a particular place can be excluded from the purview of municipalities, if a state decides to declare that area as ‘industrial township’ under an appropriate state law.
  • The second type of urban areas are known as ‘census towns’ (CTs). They are identified by the Registrar General of India (RGI) as a result of the population census exercise. CTs include all villages which satisfy the three predefined conditions of population size (at least 5,000), population density (at least 400 people/sq. km.) and non-farm workforce (at least 75% of male workforce). However, CTs continue to be governed as villages, and are part of Panchayats, which were given constitutional status under the 73rd amendment to the Constitution of India.
  • The third type of urban areas, which are neither STs nor CTs are ‘out growths’ (OGs). These include all settlements or partial settlements that always lie near a ST but outside its statutory limits. Here, the test is whether these areas possess urban infrastructure and amenities, not whether they satisfy criteria on population size, density and economic activity, like the CTs. The OGs, like CTs, are governed as rural areas.

What are the main challenges of the identification methodology of census towns or CTs?

It is important to note that the RGI finalises the rural/urban classification before the census actually happens. This is because the census schedules are different for rural and urban areas. However, there are three main challenges in the methodology used to identify CTs.

  • Firstly, it considers all STs as urban before the census is conducted. Then it identifies CTs using the previous census data. It uses a population cut-off of 4,000 in the previous census, instead of 5,000, with the working assumption that these places will have reached 5,000 people in one decade. But it requires the settlements to cross the thresholds of density (400 people/sq. km.) and non-farm work (75%), in the previous census. Due to the difference in the expected and actual population growth, some of the CTs which are classified as CTs do not satisfy some or all conditions. On the other hand, some villages, which actually satisfy these conditions are not identified as CTs. In addition, levels of non-farm work can reduce from one census to another.
  • The second problem is related to the use of one common definition for such a large and diverse country. For instance, the settlement pattern in India is very different from state to state. The average size of villages in the hilly states is relatively much smaller than plain states. Similarly, the population growth varies greatly across space.
  • The third challenge is related to the sensitivity of the definition itself. To briefly explain, if we reduce the population cut-off by 500 (3,500 people instead of 4,000 people), then 40 million more rural population in 2011 would be eligible to be classified urban in the coming census. Similarly, a reduction of 5 percentage points in the workforce criteria implies that 18 million additional rural people would be classified as urban. Researchers have also tried other methods to define urban; such as on the basis of commuting distance (Uchida and Nelson) and contiguous built-up area (Denis and Marius-Gnanou).

How did the debate on census towns start and what is the debate about?

CTs are not new in India. The RGI is classifying settlements as CTs since the 1961 census. I got interested in the subject due to the high increase in the number of CTs in Kerala combined with a high urban population growth. When I found out that almost all the urban population growth in Kerala was explained by the new CTs, I expanded that work. This work was one of the first published papers on CTs in Economic and Political Weekly. The findings of the paper, which showed, inter alia, that one third of the urban population growth during 2001 and 2011 was due to new CTs generated more interest among researchers, and the steep increase in the number of CTs from 1362 in 2001 to 3892 in 2011 was highlighted in newspapers. Some even questioned whether the large increase in the number of CTs was an attempt to inflate the extent of urbanisation. Over time, it has modified our vision of an urbanisation driven only by large cities and opened new debates on topics, such as: how are these CTs spread across India? Are the economic structures and the access to amenities in these CTs different from villages of a similar size? What are the governance challenges of CTs? And, most importantly, what is happening beyond large cities?
Are census towns evenly spread across the country? Are there any other important characteristics you want to highlight?

The concentration of CTs is disproportionately high in few states. West Bengal (780) had the maximum number of CTs in 2011, followed by Kerala (461), Tamil Nadu (376) and Maharashtra (278). Almost the entire growth in urban population in Kerala between 2001 and 2011 was due to additional CTs.  This share was also very high in West Bengal.

In terms of their distribution across districts, on an average, the highly urbanised districts and their neighboring districts have a higher number of CTs. It implies that many CTs lie close to existing urban areas. Using different straight line distances according to the size of STs, we found that 42% of the total CTs were close to class-I towns (population greater than 100,000).

The remaining 57% CTs which were not proximate to any class-I STs can further be divided into two separate groups.  The ‘clustered’ CTs are not close to Class-I towns but lie close to other CTs or a smaller ST. The remaining CTs, that we can call ‘isolated’ CTs are standalone CTs, and often lie in strategic locations such as in major industrial units or near a national highway or road junction. Of the remaining 57% non-proximate CTs, 68% fall in the first category and 32% fall in the second category. Figure-1 shows a schematic picture of the three different types of CTs.

You have mentioned that the RGI uses the last census data to identify census towns. Is it possible then to predict the number of census towns for the upcoming census?

Yes. It is possible to broadly predict the number of CTs for the 2021 census, but there are few caveats.

First, the RGI includes plantation, livestock, forestry, fisheries and allied activities as farm activity in the CT estimation, but the census data that is publicly released combines them with the non-farm workforce. It requires some adjustment as these sectors are heavily concentrated in some districts (like tea gardens in Assam, fisheries in Kerala etc.). Consequently, the final result depends on the way this adjustment is done.

Second, there are some settlements which might be identified as CTs using the 2011 census data, but may merge into the existing cities or convert to new towns or STs during this period. It is difficult to predict the magnitude of this phenomenon. With these caveats in mind, our estimate suggests that 2149 CTs may come up in the upcoming 2021 census and the broad regional distribution of these CTs would be similar to the existing ones.
You have insisted on the importance of non-farm workforce to define census town. Since the share of non-farm work force is going up, can we expect more census towns in coming years?

It is true that the share of the non-farm work force, on an average, is increasing over time. Hence one would expect more CTs in future. But the process is much more complex than it seems and one should not ignore the dynamics at the micro level. It is not true that the non-farm share is increasing in all settlements. More importantly, Sidhwani (2014) has shown that this process is not uni-directional: many villages do indeed show a decreasing share in the non-farm workforce and some of them are large villages. The amount of research focused on understanding such processes is limited and hence the actual reasons behind these processes are unclear. So, classifying a village as a CT and then again reclassifying it back to a village is not unprecedented. Further, the increase in non-farm work force is not necessarily associated with the expansion of formal employment but is more often due to increase in casual employment in the non-farm sector.
The central government last year asked state governments to convert all census towns into statutory towns. What is your reaction to that move?

I don’t think converting all CTs into STs is the right approach. It should be done on a case by case basis. As I have already mentioned, in India, it is the state government, which decides on the creation of new STs and the minimum criteria is not uniform across states. The minimum population criteria for the smallest type of municipalities ranges from 5,000 (Punjab) to 30,000 (West Bengal). So, unless states use their prerogative power or combine settlements to achieve that population threshold, it is unlikely to convert all CTs into STs. It is instructive to remember that in the last decade only 42 new STs were created.

Further, I have highlighted different types of CTs. Conversion of CTs into STs could be useful for planned governance of some of the CTs, in particular, for some of the larger ones. However, the applicability of this particular mechanism to all CTs is very doubtful and it should be done on a case by case basis. For example, if a CT is in the periphery of a large city, merging the CT into the city could be more helpful. Similarly, if multiple CTs lie close to each other, they can be combined together to make a larger ST.

The other piece in the series can be accessed below:

What is the implementation status of reservation for disadvantaged children in private unaided schools under RTE?

AMBRISH DONGRE AND HIS COLLABORATORS SHARE FINDINGS IN THE LATEST CO-AUTHORED STATE OF THE NATION REPORT
EDUCATION RIGHTS

Context

This report describes the status of implementation of the section 12(1)(c)of the Right of Children to Free and Compulsory Education (RTE) Act.

This section sets aside at least 25 per cent of the seats at entry level (pre-primary or grade 1) for children from economically weaker and disadvantaged sections of society at no cost to these children in: i) private unaided schools (non-minority) and, ii) special category schools.

The unaided schools that admit children through section 12(1)(c) are reimbursed a stipulated amount based on the comparison between actual amount charged by the school and recurring per student expenditure incurred by the government. This recurring expenditure is notified by the state governments from time to time, and is referred to as ‘notified costs’.

By mandating the inclusion of underprivileged children in private unaided schools, it acknowledges and challenges the existing hierarchies in access to education. Its effective implementation requires the government to create a system providing administrative, financial, and legal support.

What was the research about?

The report documents:

Procedural design of the admissions process and systems – especially online admission processes – followed in Gujarat, Karnataka, Madhya Pradesh, Maharashtra, and Rajasthan, as well as the initial implementation of online portals in Chhattisgarh and Uttar Pradesh;
Concerns and challenges faced by multiple stakeholders in relation to the online admission process;
Parents’ experiences of 12(1)(c) application process, and further experiences once the child is admitted to school through 12(1)(c);
Issues surrounding reimbursements to private schools that admit children under section 12(1)(c) and overall expenditure incurred for 12(1)(c) by the government;
Legal developments in relation to 12(1)(c).
How was the research conducted?

Information about admission processes was obtained from concerned officials in respective states. Attempts were also made to interact with parents who had applied through 12(1)(c); school administrators; and various non-governmental organisations and individuals who work in this space. Capturing parental experiences during the application process and once the child was admitted to a school through 12(1)(c) was the outcome of an extensive data collection exercise carried out in Ahmedabad. Additionally, budget documents were analysed to estimate per child expenditure on children in government schools while legal documents were scrutinised to understand the legal developments around section 12(1)(c).

Key findings

Non-implementation of 12(1)(c)

Out of 36 States and Union Territories (UT) in India, only 1 Union Territory and 11 States initiated action as evidenced by their seeking funds from the Central Government for implementation of this mandate, as the rules allow them to. These States include Chhattisgarh, Delhi, Gujarat, Jharkhand, Karnataka, Madhya Pradesh, Maharashtra, Odisha, Rajasthan, Tamil Nadu, Uttarakhand, and Uttar Pradesh. Despite more than five years of the RTE coming into force, more than half of the States/ UTs have not implemented this section.

Of the states that are implementing this mandate, a number of them implement section 12(1)(c) through a centralised online admission process (details given below).

Admission Processes

The report finds that the centralised admission process has improved administrative control and transparency in the admission process. However, the process, with its reliance on internet and absence of support structure, has also created access barriers.

The report describes experiences of applicants in Ahmedabad (Gujarat) where centralised online application process was implemented for the first time in admissions through section 12(1)(c) for the academic year 2017-18. Though the centralised online application potentially allows for a number of improvements over a paper-based system, the implementation of it highlighted many problems.

Lack of internet access, heavy reliance on cyber cafes and consequently higher expenses incurred for the application process, combined with problems faced by applicants in filling application forms were the direct fallout of the online process. In addition, complete absence of or inadequately equipped help-centres; lack of effective grievance redressal mechanisms; confusion around eligibility criteria; lack of synchronisation with admission cycle for seats, which are not reserved i.e. rest of the 75% seats exacerbated the complexity of the application process. Some of these problems were evident in other states as well.

The report offers a range of recommendations to improve this situation.

Lottery mechanisms

The report also compares the logic (of lottery) used for allotment of seats to applicants. Based on interviews with concerned officials from four states, the researchers found systematic differences in the logic used across these states. There were differences on accounts of public disclosure, ordering of applicants’ preferences for schools, and format of result declaration. For example, in some states (like Madhya Pradesh, Karnataka and Gujarat) applicants received allotment to only one school whereas in Maharashtra, an applicant could receive a confirmed allotment to multiple schools, of which one would be selected by the applicant. On the other hand, applicants in Rajasthan received priority numbers for each school applied.

Evidence from Ahmedabad based on a large scale survey

The report also presents findings from a child tracking study of over 1600 households in Ahmedabad.

The child-tracking study finds that although most eligible households are likely to apply if informed about the provision, information alone is insufficient to successfully navigate the various stages of the application and admission process. There are barriers in the form of transaction costs and information access, which prevent the more disadvantaged households from applying and receiving allotment of a seat. For example, many households need to procure documents such as caste certificates and income certificates for the process, which is both time consuming and costly.

More educated households and those with local language (Gujarati) as their mother tongue, which increases the access, may be at an advantage, as suggested by higher application and allotment rates of households with these characteristics.

Further, in a first attempt of this kind in the context of section 12(1)(c), the data shows that over 96% of those who had admitted their child through the policy in June, 2015 continued to attend the same school in December, 2016 (when the data was collected).

Once children are admitted to schools through 12(1)(c), preliminary findings suggest that fewer of them participate in extracurricular activities such as sports and cultural activities compared to those enrolled in private schools without the provision. Such challenges are a cause of concern and merit further exploration.

Issues around reimbursement

Analysis of budget documents reveals that there is discrepancy between notified per student reimbursement costs and actual per student expenditure by government as estimated by the researchers. Sources of this discrepancy are difficult to locate due to lack of clarity on how these notified costs are derived in the first place. Analysis, detailed in the report, also points to the possibility that most of the schools admitting children under 12(1)(c) are low cost/fee private schools. What that means for inclusion and learning needs to be analysed.

Legal Developments

The chapter on legal developments draws attention to issues related to Section 12(1)(c). The researchers find that while the courts have resisted efforts to narrow the eligibility criteria (like using the criteria of having a Below Poverty Line (BPL) card as the only way of identifying Economically Weaker Section (EWS) candidates), they have generally stayed away from ruling on administrative procedures like the mode of admissions. The courts have been particularly proactive with regard to ensuring the benefits of the mandate reach children with needs.

Way forward

The report makes specific and detailed recommendations on various aspects of the implementation of section 12(1)(c) such as clarity in rules regarding eligibility criteria; not relying exclusively on GPS for defining neighbourhoods; more time for application process; building a robust Management Information System to manage expenditure and reimbursement effectively; creative and informative communication campaigns; online and offline modes of application; timely and adequate reimbursements; and child tracking. More broadly though, the report calls upon government officials, judiciary, and private stakeholders for their active participation in ensuring effective implementation of 12(1)(c).

What Matters for Urban Women’s Work: A Deep Dive Into Falling Female Labour Force Participation

CHAPTER BY SHAMINDRA NATH ROY AND PARTHA MUKHOPADHYAY IN OXFAM INDIA’S REPORT ‘MIND THE GAP: THE STATE OF EMPLOYMENT IN INDIA’
ECONOMY

India is one of the lowest globally in terms of female labour force participation (FLFP), ranking only better than Pakistan in South Asia. While the decline in FLFP in rural areas is starkly visible, the urban FLFP has been consistently low since the 1980s despite higher economic growth and increasing level of education among females. The economic offset created by such low FLFP is huge and if, for instance, it (16.8%) could be raised to the level of FLFP in China (61.5%)[1], it has the potential to raise India’s GDP up to 27%. This chapter attempts to investigate the structural deficiencies behind this consistently low urban FLFP through a variety of perspectives, ranging from measuring the complexity of women’s work to the implications of caste, location and family structure. It finds factors like presence of female-friendly industries, provision of regular salaried jobs and policies that cater to women’s needs to work near home like availability of part-time work, can improve the situation, though prejudices arising from patriarchy require to be addressed to make these measures truly transformative and not palliative.

[1] This is from the International Labour Organisation (ILO) model estimate for 15+ population in the World Development Indicators of the World Bank, 2018.

The full chapter in the report can be accessed here.

Where is food inflation headed?

Price increases have been largely in imported items like edible oils and pulses. There is no generalized food inflation yet only because of subdued demand conditions.

Low inflation, particularly in food items, was a significant feature of the Narendra Modi government’s first term in office. Annual Consumer Price Index (CPI) inflation averaged 4.3% during that period from June 2014 to May 2019. It was even lower, at 3.3 %, for the Consumer Food Price Index (CFPI) inflation. There was also an extended period, from September 2016 to August 2019, when the CFPI inflation rate ruled below general CPI inflation in each of those 36 months.

The Modi government’s second term has been different by contrast. Between June 2019 and May 2021, average annual CPI inflation has been 5.7%, while even higher, at 7.4%, for CFPI inflation. The chart below captures these trends. In combination with retail prices of petrol, diesel and LPG rising since June 2019 – from Rs 71.73/litre, Rs 66.51/litre and Rs 712.5/cylinder to Rs 97.76, Rs 88.30 and Rs 809, respectively in Delhi – it is clear that both food and fuel inflation have returned (Just for comparison: On May 31, 2014, petrol retailed at Rs 71.41/litre, diesel at Rs 56.71/litre and LPG at Rs 414/cylinder).

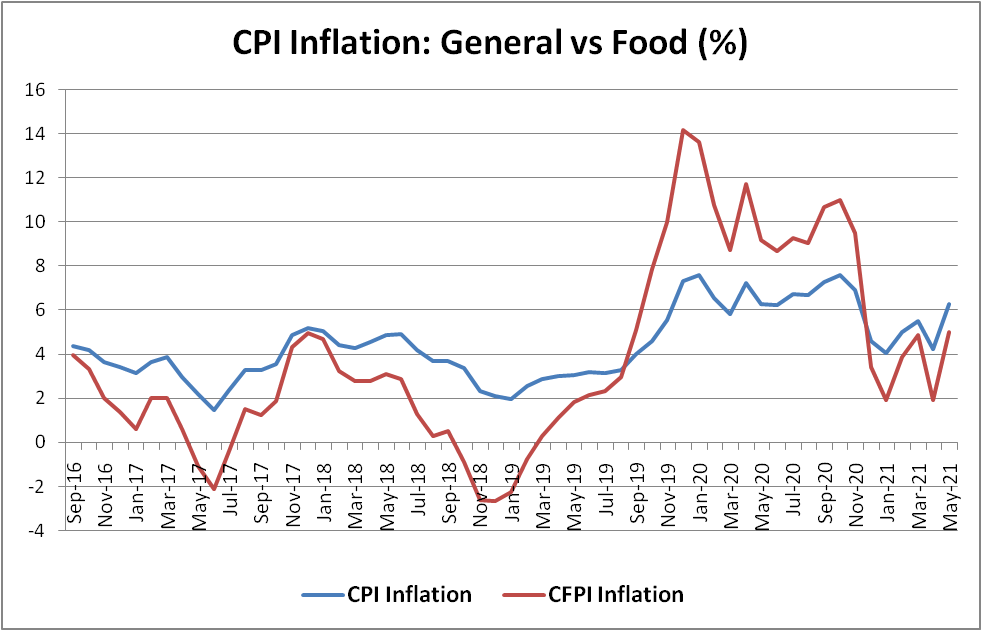
Source: National Statistical Office.

Much of the above inflation is imported, which is most obvious in fuel. Between May 2020 and May 2021, the average price of crude oil imported by Indian refiners has more than doubled from $30.61 to $66.95 per barrel (Brent has since breached the $75/barrel psychological level). This has, however, also been exacerbated by the Modi government hiking the excise duty on petrol and diesel by Rs 13 and Rs 16/litre, respectively during March-May 2020.

In the case of food inflation, too, the fall during the Modi-1 period was substantially enabled by international prices. Between May 2014 and May 2019, the UN Food and Agriculture Organization’s (FAO) world Food Price Index (FPI) dropped from 121.3 to 94.2 points (base year 2014-16=100). The global FPI inflation rate, however, started climbing from October 2019. That was roughly when domestic CFPI inflation also crossed the 5% mark for the first time in over three years. Both global and domestic food inflation saw an uptrend till February 2020, before the novel coronavirus pandemic struck. There was a divergence thereafter. The FPI inflation crashed, even as CFPI inflation remained at near double digits till November.

India’s food inflation began easing with the harvesting of the post-monsoon kharif crop, interestingly, when a recovery in global food prices was gathering steam. The FAO-FPI inflation started soaring from around October, as demand returned with economies unlocking and restoration of supply chains taking time. Dry weather-induced production shortfalls in Brazil, Argentina, Ukraine, Thailand and even the US, along with Chinese stockpiling, added fuel to the fire. The FAO-FPI hit 127.1 points in May 2021, its highest level since September 2011. On the other hand, retail food inflation in India, even at 5% in May, was way below the corresponding global rate of close to 40% (see chart below).

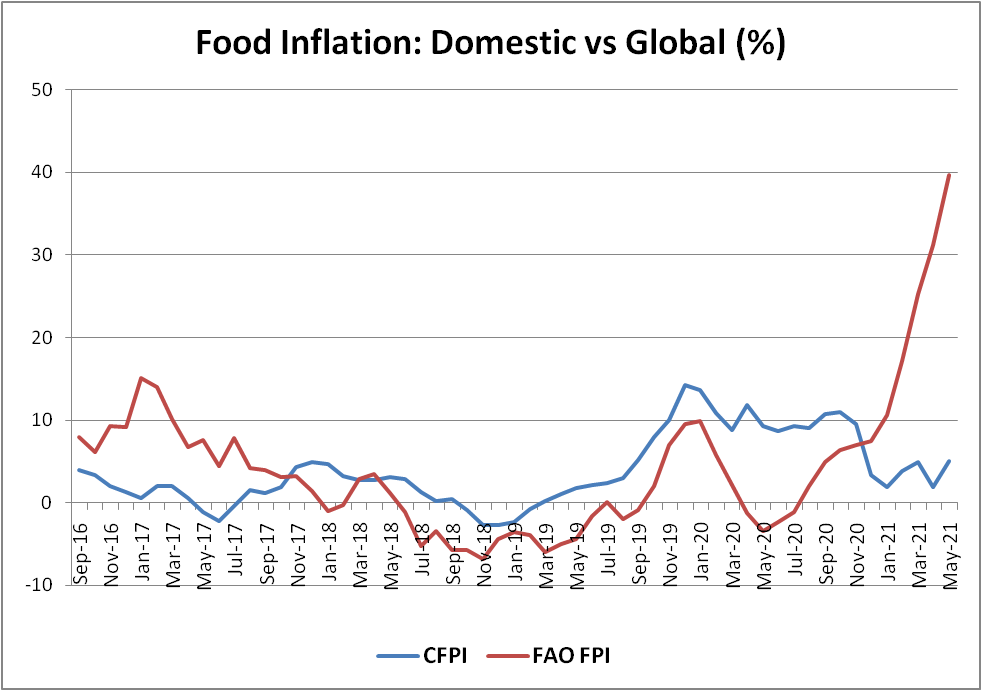
Source: National Statistical Office and FAO.

The impact of surging global prices on domestic food inflation has been largely on commodities that India significantly imports. The country annually imports 13-15 million tonnes (mt) of edible oil and produces only 7.5-8.5 mt. In pulses, domestic output has gone up from 15-16 mt to 22-23 mt in the last five years. While imports have also halved to 2.5-3 mt, they do still exert considerable influence on domestic prices.

The table below shows that edible oil and pulses are the food items to have registered the highest price increase in the last one year. At the same time, cereals, sugar, milk and even staple vegetables (potato, onion and tomato) have recorded little or no inflation.

All-India Modal Retail Price (Rs/kg)

Year ago Current
Mustard oil 120 160
Soyabean oil 100 160
Sunflower oil 110 175
Groundnut oil 145 180
Palm oil 85 135
Chana dal 60 80
Tur/Arhar dal 95 110
Urad dal 100 110
Rice 28 30
Wheat 27 22
Milk 46 46
Sugar 40 40
Potato 25 20
Onion 20 25
Tomato 20 18

Source: Department of Consumer Affairs.

The reasons are two-fold. The first is that these are foods predominantly produced domestically. The good monsoons in 2019 and 2020 – India, Australia and Canada were the only top agricultural powerhouse countries that did not face serious weather-related issues – have ensured no supply shortages in their case. The second reason has to do with the collapse of demand from successive Covid-triggered lockdowns. With hotels, eateries, sweetmeat shops, hostels and canteens either shut or operating at low capacity, apart from no wedding receptions and other public functions, food demand has been confined mostly to households. Even household consumption has probably been affected because of incomes taking a hit from the reduction in overall economic activity.

Simply put, while food inflation has made a comeback in India, it is not yet generalized in terms of sustained across-the-board price increases, of the kind witnessed during the previous United Progressive Alliance regime’s second term from 2009-10 to 2013-14. As of now, inflation is only in imported food items.

There are three factors that would influence the course of food inflation in the coming months. The first is international prices. The FAO’s benchmark index is now at a near-decade-high. It must be noted, though, that the same index, only a year before (May 2020), had plunged to 91 points, its lowest in four years. Whether the current global price surge is a pointer to a renewed “commodity supercycle” or simply a result of temporary supply-side disruptions remains to be seen.

The table below shows that global prices of all major agricultural commodities have risen considerably over last year. But they have also fallen off their peaks, which were mainly reached in May and reflected in the FAO price index for that month. The decline from the peaks is visible especially in palm and soyabean oil. That should, in turn, have some salutary effect back home. Cooking oil is the one item that has been really on fire in recent months!

International agri-commodity prices

Unit Current Year ago Recent peak
Wheat Cents/bushel 652.00 485.75 761.75 (May 7)
Corn Cents/bushel 653.25 324.25 735.25 (May 7)
Soyabean Cents/bushel 1371.25 870.75 1642.50 (May 12)
Palm oil Ringgit/tonne 3421.00 2436.00 4506.00 (May 12)
Raw sugar Cents/pound 17.24 11.84 18.10 (May 11)
Coffee Cents/pound 153.40 97.80 162.35 (May 31)
Skim milk powder US$/tonne 3356.00 2609.00 3447.00 (May 18)
Cotton Cents/pound 94.95 68.00 98.50 (Feb 24)
Rubber US$/100 kg 204.40 152.50 272.40 (Oct 28)

Note: Wheat, corn and soyabean prices refer to the most actively-traded futures contracts at the Chicago Board of Trade. One bushel equals 27.2155 kg of soyabean and wheat and 25.40 kg of corn. Raw sugar and coffee prices are for the most actively-traded futures at the Intercontinental Exchange. Skim milk powder price is the average at the fortnightly Global Dairy Trade auctions. Crude palm oil price is for the most actively-traded futures at the Bursa Malaysia exchange.  Rubber price is for RSS-4 grade at Bangkok. Cotton price is the average based on the Cotlook ‘A’ index.

The second factor that will determine the outlook for food inflation in India is the monsoon. While the rains were 74% surplus in May, the southwest monsoon season (June-September) has itself so far recorded 26% above-average rainfall. These should induce higher kharif crop plantings that have already taken off. But since production is a function of both acreages and yields, a great deal rests on the rains during July-August, when the crop reaches the vegetative growth stage. 2019 and 2020 were excellent monsoon years. A third successive good monsoon should effectively put a lid on food inflation. That would be even more so if farmers expand acreages under oilseeds and pulses, which looks quite probable given the current market prices.

A third factor is the impact of fuel cost increases. The scope for their pass-through to consumers is today limited in an overall demand-constrained environment. Take milk. Dairies incur cost for its transport, first from the village collection centres to the processing plants that generally takes place in 2,000-3,000 litres mini-trucks. The milk that is pasteurized and packaged is further dispatched from the plants to the markets in bigger 10,000-15,000 litres tankers. Most dairies haven’t raised pouch milk prices, despite diesel costs going up by over Rs 15/litre in the last one year alone. What many of them have, however, done is reduce the prices paid to farmers. In Maharashtra, for instance, procurement prices of cow milk containing 3% fat and 8.5% solids-not-fat have fallen from Rs 31-32 per litre in February-March (pre-second wave) to Rs 21-25 now. In other words, the fuel pass-through has happened not by revising upwards the prices to consumers, but by lowering the prices paid to producers. In the event of a general growth and demand revival – whenever that happens – we could see processors, transporters and even farmers passing on the increase in fuel costs to consumers.

To the above three likely determinants, one may add a fourth, which is political. The Modi-1 administration’s tenure was marked by hawkishness on food inflation and privileging consumers over producers. During Modi-2, there has been focus on expanding minimum support price-based procurement, with new records in government purchases, particularly of wheat and paddy, getting established. Some of that has been prompted by the farmer protests against the Centre’s three agricultural reform laws.

The upcoming state elections in Uttar Pradesh might elicit similar political response in respect of sugarcane, where the minimum price payable to growers has hardly been revised during the four years of the Yogi Adityanath-led administration. How much of sugar price increase would the Modi government allow, in order to enable mills to pay more and on time to cane farmers? These are the kind of questions it may have to confront in other crops too, where the domestic supply-demand balance and international price environment are also more favourable to producers than a year ago.

Find all previous notes as part of the series here:

Who Becomes a Slum Leader in Urban India?

A TALK BY TARIQ THACHIL
URBAN GOVERNANCE

Listen to a talk (above) by Thariq Thachil, Peter Strauss Assistant Professor of Political Science at Yale University where he presents the findings from his paper ‘Who Becomes a Slum Leader in Urban India?’

The talk describes the results and inferences from a study conducted by Adam Auerbach and Tariq Thachil that investigates the role of political brokers in the slums of two Indian cities. The study, based on an extensive survey experiment with 2,199 residents across 110 slum settlements in Jaipur and Bhopal, broadly found that slum leaders emerge through bottom-up selection by slum residents.