- Home
- About Us
- Research
- Research Areas
- Agriculture
- Air Pollution
- Climate Change
- Economy
- Education
- Environmental Law & Justice
- Energy & Electricity
- Federalism
- Governance, Accountability & Public Finance
- Health & Nutrition
- Indian Politics
- International Relations & Security
- Jobs
- Land Rights
- Sanitation
- Social Justice
- State Capacity
- Technology
- Urbanisation
- Water
- Miscellaneous
- Research Initiatives
- Research Areas
- Publications
- People
- Events
Highlight>
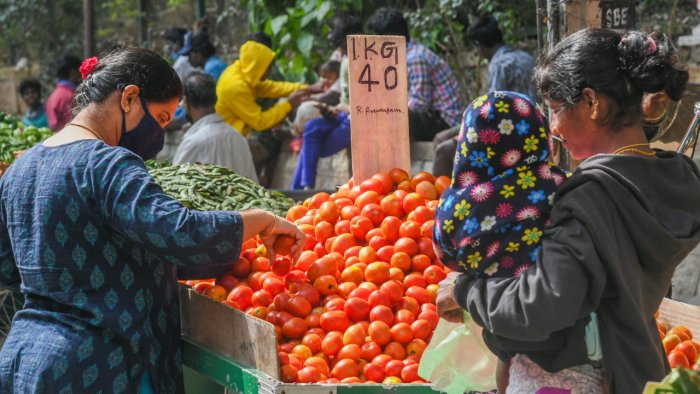
The future of MSP
December 23, 2021
In 1876 – a year after the so-called Deccan Riots, in which indebted Maratha peasants raided the shops and homes of village moneylenders to burn all mortgage deeds and other records lying with them – the British India government initiated the construction of the Nira Left Bank Canal in Pune district. This was followed by the opening of the Girna, Godavari and Pravara canals in Nashik and Ahmednagar during 1910 to 1920.
The colonial authorities had originally conceived these canals as “protective” irrigation works, enabling farmers in a semi-arid drought-prone region to raise their normal subsistence crops of jowar (sorghum) and bajra (pearl millet). What they ended up doing, instead, was convert western Maharashtra into a premier sugarcane-growing belt.
The reason for the Deccan canals turning from “protective” to “productive” works, with their waters being used mainly for cultivation of “cash” (in this case, sugarcane) as opposed to “subsistence” crops, was simple: Why would farmers want to pay for irrigation if they were just producing grain for home consumption? Spending money on water for jowar or bajra made sense only in years when the rains had totally failed. In normal years, no farmer would use canal water that, unlike rainwater, did not come free. The demand for irrigation on a regular (as against emergency) basis even in ordinary (non-drought) years could come only from farmers growing cash crops. Recovering the cost of irrigating their fields was possible only through sale of these crops. The canal works, too, wouldn’t pay for themselves if the water in the dams, built and stored at a great cost, had no assured takers even in normal years.1
The above lesson from history is relevant in today’s times, when there is a demand from farmer organizations to make minimum support prices (MSP) a “legal entitlement” for all crops. What began as a movement for rolling back the three agricultural reform laws enacted by the Narendra Modi government in September 2020 – these were formally repealed by Parliament on November 29 – has since grown into one that itself demands the introduction and passage of a legislation conferring mandatory status to MSP. And this is a demand having universal appeal, beyond the farmers of Punjab, Haryana and western Uttar Pradesh (UP).
MSP and Irrigation
MSP in India has had the same limitations as irrigation; the benefits in both have flowed largely to farmers of a few crops and regions. MSP’s effectiveness has been a function of implementation on the ground, either through direct government procurement or forcing private industry to pay. Such effectiveness, as the table below shows, has been mostly confined to four crops: Sugarcane, paddy/rice, wheat and cotton. While MSP implementation in the latter three takes place via procurement by government agencies such as the Food Corporation of India (FCI), National Agricultural Cooperative Marketing Federation of India (NAFED) and Cotton Corporation of India (CCI), in sugarcane, it is the mills that are, by law, required to pay the Centre’s “fair and remunerative price” to growers (UP, Haryana, Punjab and Uttarakhand fix even higher “state advised prices”). MSP coverage in these four crops accounts for nearly three-fourths of the country’s sugarcane production, while amounting to roughly 50% for paddy/rice, 40% for wheat and 25% for cotton.
How much of production gets procured at minimum support price
(In lakh tonnes)
| Crop | Procurement | Production | % Procurement | |||
| 2019-20 | 2020-21 | 2019-20 | 2020-21 | 2019-20 | 2020-21 | |
| Sugarcane* | 2503.67 | 2984.24 | 3705.00 | 3992.53 | 67.58 | 74.75 |
| Rice | 518.26 | 600.74 | 1188.70 | 1222.70 | 43.60 | 49.14 |
| Wheat | 389.92 | 433.44 | 1078.60 | 1095.20 | 36.15 | 39.58 |
| Cotton** | 105.15 | 91.89 | 365.00 | 353.84 | 28.81 | 25.97 |
| Chana | 21.43 | 6.30 | 110.80 | 119.90 | 19.34 | 5.25 |
| Tur | 5.36 | 0.11 | 38.90 | 42.80 | 13.78 | 0.26 |
| Mustard | 8.04 | 0 | 91.24 | 101.12 | 8.81 | 0 |
| Groundnut | 7.21 | 2.84 | 99.52 | 102.10 | 7.24 | 2.78 |
| Moong | 1.47 | 0.20 | 25.10 | 30.90 | 5.86 | 0.65 |
| Sunflower | 0.05 | 0.04 | 2.13 | 2.30 | 2.47 | 1.69 |
| Soyabean | 0.11 | Neg. | 112.26 | 128.97 | 0.09 | 0 |
| Masur | 0.01 | Neg. | 11.00 | 14.50 | 0.13 | 0 |
Note: Figures are for agriculture year (July-June). For sugarcane, it is October-September. Only crops with minimum 1,000 tonnes procurement are taken; *Procurement by sugar mills; **In lakh bales of 170 kg each.
Source: FCI, NAFED, CCI, National Federation of Cooperative Sugar Factories and Ministry of Agriculture & Farmers’ Welfare.
Two points are worth noting here. The first is that the four above-mentioned crops have just over 22% combined share of the total value of India’s agricultural output from crops and livestock products.2 Secondly, all four are relatively water-guzzling. Almost 100% of sugarcane and wheat area in India is under irrigation. The same goes for paddy/rice grown in Punjab, Haryana, Telangana, Andhra Pradesh and Tamil Nadu, which together contributed to about 60% of the grain procured by government agencies in 2020-21.3 Even cotton requires anywhere from 6 to 12 irrigations (https://bit.ly/3GNGb7I), given its long duration of 6-8 months compared to 3-4 months for groundnut, soyabean and most pulses. Farmers who sow cotton in mid-June to early-July after the southwest monsoon rains typically harvest the crop over 4-5 pickings by mid-December to early-January, with some continuing to pick till February-end or beyond. That makes it equivalent to growing two crops, which, in turn, presupposes access to basic irrigation.
Simply put, provision of irrigation facilities to farmers in India has induced them to plant water-guzzling cash crops. This is due to their not wanting to “waste” scarce yet assured water on growing crops solely for self-consumption. Irrigation has gone hand in hand with cash cropping. The existing MSP regime has further reinforced this tendency. With irrigation boosting yields and MSP purchases assuring a stable market, farmers have found it more remunerative to produce crops benefiting from both forms of support. And if this weren’t enough, these crops have also received priority by way of public breeding and research support.
The early Green Revolution varieties in wheat – Kalyan Sona and Sonalika in the mid-1960s and HD-2285 and HD-2329 in the mid-1980s – raised potential yields from 10-15 quintals to 45-50 quintals per hectare. They have gone up further to 70 quintals-plus with HD-2967 and HD-3086 in the current decade (https://bit.ly/3dUUxqw). In paddy, recent breeding efforts have reduced crop durations by 20-30 days with minimal yield sacrifice (https://bit.ly/3GPcnYF), while also enabling dry direct seeding, as opposed to flooded-field transplanting (https://bit.ly/3sfCtzI). The release of the blockbuster Co-0238 cane variety has, likewise, transformed UP’s sugar industry. It has resulted in average cane yields in the state rising from below 60 tonnes to over 80 tonnes per hectare and sugar recoveries of mills from 9-9.25% to 11-11.5% since 2011-12 (https://bit.ly/3pSEEXk and https://bit.ly/3sn0AwC).
The most recent example of irrigation and MSP creating a bias towards water-guzzling cash crops is Telangana. Since 2014-15, the Kaleshwaram Lift Irrigation Project and schemes for micro-irrigation and revival of village tanks under Mission Kakatiya has increased the proportion of the state’s net sown area that is irrigated from 39% to 53%. It has led to a huge jump in paddy production, with its share in the state’s gross cropped area soaring from 26.6% to 50.3% between 2014-15 and 2020-21. This has been accompanied by a six-fold rise in government procurement (see table below). Telangana has, in fact, emerged as the second biggest contributor of paddy to the Central pool after Punjab (https://bit.ly/3F1ycUq), while being ranked No. 1 in cotton procurement (https://cotcorp.org.in/msp.aspx). Cotton is Telangana’s second largest crop, with its area of 61 lakh acres in 2020-21 next only to paddy’s 103 lakh acres.4
Telangana’s paddy and cotton revolution
| Paddy* | Cotton** | |||
| Production | Procurement | Production | Procurement | |
| 2014-15 | 68.2 | 24.32 | 50.50 | 36.91 |
| 2015-16 | 45.7 | 23.57 | 58.00 | 5.95 |
| 2016-17 | 99.0 | 53.67 | 48.00 | 0 |
| 2017-18 | 93.9 | 54.00 | 54.44 | 2.63 |
| 2018-19 | 100.0 | 77.46 | 42.00 | 7.77 |
| 2019-20 | 193.0 | 111.26 | 54.00 | 41.80 |
| 2020-21 | 251.0 | 141.11 | 59.95 | 34.01 |
Note: *lakh tonnes; **lakh bales of 170 kg each.
Source: Government of Telangana, FCI and CCI.
Outlived policy
Promotion of rice, wheat and sugarcane cultivation through MSP procurement/enforcement and expansion of irrigation wasn’t really bad policy, when the production of these carbohydrate-dense foods had to be increased in order to meet the country’s growing requirements. That situation does not, however, hold today when India has become surplus in cereals and sugar. Data from successive National Sample Survey rounds points to declining or stagnant per capita household consumption of both items (see table below).
All-India per capita household consumption
(In kg over 30 days)
| Cereals* | Sugar** | |||
| Rural | Urban | Rural | Urban | |
| 1993-94 | 13.40 | 10.60 | 0.78 | 0.96 |
| 1999-2K | 12.72 | 10.42 | 1.08 | 1.32 |
| 2004-05 | 12.12 | 9.94 | 0.74 | 0.87 |
| 2011-12 | 11.22 | 9.28 | 0.78 | 0.86 |
Note: *Includes atta and other cereal flours; *Includes gur.
Source: NSS rounds.
At 10 kg per capita per month, India’s annual household cereal consumption requirement for a 1.4 billion population would come to around 168 million tonnes (mt). Even taking 25% additional consumption in processed form (as bread, biscuits, cakes, noodles, vermicelli, flakes, etc) plus another 25 mt of grain (mainly maize) used for feed or starch, the total yearly demand will not exceed 235 mt. As against this outer limit, India’s cereal output has averaged 265 mt during 2016-17 to 2020-21 (https://bit.ly/3J9AbbJ). Allowing for official exaggeration, which might be offset by our own over-estimation of demand, it still yields a surplus of at least 25 mt. This is the excess that’s being produced every year and putting pressure on market prices, if not adding to government stocks. Evidence of that is seen in the table below: At 81.6 mt as on October 1, total stocks of rice and wheat in public warehouses were more than 2.5 times the required operational-cum-strategic reserves for this date and twice the levels five years ago. This is even after the all-time-high offtake of 93.11 mt in 2020-21 and another 45.91 mt in April-September 2021 under the National Food Security Act and various post-Covid welfare schemes. On top, India has exported record quantities of cereals: 22.83 mt in 2020-21 and 14.26 mt in April-September 2021. We have already alluded to these trends in a previous note (https://bit.ly/3spCP78).
Rice and wheat stocks in Central pool
(In lakh tonnes)
| Oct 1, 2016 | 372.00 |
| Oct 1, 2017 | 433.36 |
| Oct 1, 2018 | 553.69 |
| Oct 1, 2019 | 669.49 |
| Oct 1, 2020 | 684.88 |
| Oct 1, 2021 | 816.03 |
Source: FCI.
It’s not very different in sugar, where the direct household consumption, even at 1 kg per capita for 1.4 billion people, would work out to 16.8 mt. Adding another 50% indirect consumption by sweetmeat, confectionary, soft drink, ice-cream and other industrial users will take that to 25-26 mt. Again, this has been trailing production, which has averaged close to 29 mt in the last five years and crossing 33 mt in 2018-19. With mills accumulating stocks – these were equivalent to 7 months of domestic consumption at the start of the 2019-20 crushing season – they have defaulted in payments to sugarcane growers. This, notwithstanding MSP of cane being a statutory obligation and payable within 14 days of purchase! The excess stocks have, then, had to be liquidated through heavily-subsidized exports and diversion of sugar for the ethanol-blended petrol programme (https://bit.ly/3ecJg5m).
Things aren’t as unsustainable in cotton, though, for three reasons. The first is that in states like Punjab, Haryana and even Telangana, paddy farmers can be encouraged to switch to cotton, which in any case consumes less water than the former. Secondly, cotton has no significant demand problems, unlike rice, wheat and sugar. Thirdly, lint (the white fibre that textile mills spin into yarn) constitutes only roughly 34% of the kapas or raw un-ginned cotton that farmers bring to the market. The balance is seed (65%) and moisture (1%). Cotton seed further yields both oil and cake. One of the useful byproducts of the genetically modified Bt revolution has been India’s cottonseed oil production trebling since 2003-04. With an estimated output of 1.25 mt in 2020-21, it was India’s third largest domestically produced vegetable oil after mustard (2.74 mt) and soyabean (1.33 mt).5 There’s no dearth of market either for lint (which is also exported) or cottonseed oil and cake (used as a protein ingredient by livestock feed manufacturers).
The road ahead
From our analysis, it is clear that the existing MSP procurement regime is neither economically nor agro-ecologically sustainable. Being skewed towards four crops, in terms of actual government procurement or enforcement, it incentivizes their production beyond the country’s consumption requirements. Such overproduction has been particularly pronounced in the last 5-6 years, a period coinciding with low price realizations on account of a variety of factors – from the collapse of a decade-long agri-commodities boom after 2014, to demonetization and inflation-targeting policies back home (https://bit.ly/3moY6dv). Those have engendered risk aversion among farmers and led them to expand production of MSP-protected crops that, we saw, are also relatively water-intensive. All this, of course, applies more to rice, wheat and sugarcane than to cotton.
Making MSP legally enforceable on all crops can potentially address the aforesaid distortions. To start with, farmers can be assured of getting MSPs for at least the 23 officially notified or “mandated” crops (https://bit.ly/3qjI99j). It should further be possible to fix MSPs in such a way to ensure higher returns (maybe C2 costs plus 50%) on crops consuming less water than the others (which may be entitled to not more than A2+FL plus 50%).6 This would help break the perverse reinforcing nexus between MSP and irrigation.
If MSP is to be made legal and implementable on all crops, the natural question that arises is how? Of the available options – government procurement at MSP, enforcing it on the private trade and price deficiency payments (PDP) – the last one seems the most workable, including from a fiscal standpoint. PDP entails the government not physically buying or stocking any grain and simply paying the difference between the market price and MSP, in case of the former ruling lower. Such payment credited to farmers’ bank accounts would be on the actual quantity of crop sold by them.
There are many advantages with a PDP scheme.
First, it would allow capping of procurement even of paddy and wheat, which is currently open-ended. Government agencies bought 103.42 mt of rice and wheat from last year’s crop, whereas the total annual requirement under the National Food Security Act and other welfare schemes isn’t more than 65 mt. With PDP, the government does not have to buy and stock beyond its operational and buffer requirements. It just needs to pay a price difference, without incurring the handling, distribution, storage and other “carrying” costs on the excess grain. The savings on this count are enormous.
Second, since price difference is payable on sales taking place in APMC (agricultural produce market committee) mandis, it would force state governments to create the necessary market infrastructure to enable their farmers benefit from PDP. Madhya Pradesh, in fact, had implemented its own PDP scheme called Bhavantar Bhugtan Yojana in the 2017-18 kharif marketing season for eight MSP crops: urad (black gram), soyabean, maize, arhar/tur (pigeon pea), moong (green gram), groundnut, sesamum and nigerseed. Despite payments of Rs 1,952 crore made to the state’s farmers (https://bit.ly/3qlCz6z) and as many as 21 lakh registering under the scheme, it was dismissed as a failure. Apart from such sweeping judgment, based on a single season’s performance7, the scheme did not receive any Central support despite the initial enthusiasm shown by NITI Aayog (https://bit.ly/33HtAVs). It died within a year of launch.
Third, the necessity for recording of transactions (including how much quantity of produce every farmer has sold) to enable payment of price difference will impart transparency, which is also key to better regulation of agricultural markets. This is, moreover, consistent with the government’s efforts at integration of APMCs across the country to create a unified national market for agricultural markets.
Fourth, assured MSP implemented through PDP would make it possible to undertake crop area planning based on water availability, soil types and market demand-supply conditions. Telangana is the first state to attempt such an exercise in the 2021 kharif season, wherein it targeted a reduction in paddy area to 41.85 lakh acres (from last year’s 53.33 lakh acres) alongside an increase in that of cotton (from 60.54 lakh to 70.05 lakh acres) and tur (from 10.85 lakh to 20.01 lakh acres). State agriculture extension officers were instructed to maintain daily data on acreages in their clusters, “with details of crops grown in each gunta (0.025 acres)”.8 But this kind of planning, to nudge farmers to switch from one crop to another, can succeed only when they have reasonable confidence about prices at the time of harvest.
That brings us to the last but not least point. Agriculture is, perhaps, the only business where there is high probability of both production and price risks (https://bit.ly/3FlFCSh). One mustn’t, therefore, beyond a point debate over the “whether and why” of legal MSP. In today’s time, it may be more worthwhile to consider “how best” to make MSP work for the farmer.
Our notes in this series in the coming days will look closer at the role of both price policy and public investment in shaping the past and future of Indian agriculture.
This note, part of the Understanding the Rural Economy series by CPR, has been authored by Harish Damodaran
Find all previous notes as part of the series here:
- Can rural play “savior” again? Agricultural seasons and COVID-19 waves by Mekhala Krishnamurthy and Harish Damodaran
- How ‘food’ has become the real social safety net in pandemic by Harish Damodaran
- Where is food inflation headed? by Harish Damodaran
- Has MGNREGS Helped the Rural Economy in 2021? by Yamini Aiyar, Avani Kapur and Harish Damodaran
- Employment U-turn: Rural India is India’s main employer by Harish Damodaran and Yamini Aiyar
- Agricultural Households and Farming Income: An initial analysis of variations in income from farming and other sources among agricultural households in India by Harish Damodaran, Mekhala Krishnamurthy and Samridhi Agarwal
- Carbohydrates to proteins and back: How dietary and cropping diversification seems to have gone into reverse by Harish Damodaran, Mekhala Krishnamurthy and Samridhi Agarwal.
- Mapping India’s livestock economy by Harish Damodaran and Samridhi Agarwal.
- Unlocking the potential of Ganna Pradesh
- The Return of Food Inflation: Why its Different this time by Samridhi Agarwal and Harish Damodaran
Notes
- For a historical background and analysis of the impact of the Deccan Canals, see Donald W. Attwood, Raising Cane: The Political Economy of Sugar in Western India, Delhi: Oxford University Press (1993), pp. 41-5, 49-67.
- These are figures for 2018-19. The total value of output from all crops and livestock produce at current prices stood at Rs 31.74 lakh crore. Out of that, the value of paddy production was Rs 3.09 lakh crore, while Rs 2.01 lakh crore for wheat, Rs 1.22 lakh crore for sugarcane and gur (jaggery) and Rs 76,211 crore for kapas (raw un-ginned cotton). See State-wise and Item-wise Value of Output from Agriculture, Forestry and Fishing, Year: 2011-12 to 2018-19, National Statistical Office (2021), pp. 362-7.
- The All-India average area under irrigation was 95.5% for sugarcane and 94.5% for wheat. In paddy, these were at 99.7% for Punjab, 99.9% for Haryana, 98.5% for Telangana, 96.7% for Andhra Pradesh and 91.6% for Tamil Nadu. See Agricultural Statistics at a Glance 2020, Ministry of Agriculture & Farmers’ Welfare, pp. 49, 51, 83. Also, see https://bit.ly/3ypqf8K.
- Socio Economic Outlook 2021, Planning Department, Government of Telangana, pp. 46-9, 52-3. Also, Telangana State at a Glance 2021, Directorate of Economics and Statistics, p. 25.
- https://seaofindia.com/sea-kharif-crop-estimate-for-2020-21/.
- A2 covers all actual paid-out costs (on seed, fertilizer, fuel, labour, water, crop protection, etc) incurred by farmers in cultivating any crop. FL is the imputed value of unpaid family labour. C2 is a more comprehensive cost that includes A2+FL plus rental value and interest foregone on own land and fixed capital assets.
- See https://icrier.org/pdf/Working_Paper_357.pdf.
- Agriculture Action Plan 2021-22, Department of Agriculture, Government of Telangana, pp. 8, 10, 13.