- Home
- About Us
- Research
- Research Areas
- Agriculture
- Air Pollution
- Climate Change
- Economy
- Education
- Environmental Law & Justice
- Energy & Electricity
- Federalism
- Governance, Accountability & Public Finance
- Health & Nutrition
- Indian Politics
- International Relations & Security
- Jobs
- Land Rights
- Sanitation
- Social Justice
- State Capacity
- Technology
- Urbanisation
- Water
- Miscellaneous
- Research Initiatives
- Research Areas
- Publications
- People
- Events
Highlight>
Agricultural Households and Farming Income: An initial analysis of variations in income from farming and other sources among agricultural households in India
Harish Damodaran, Samridhi Agarwal, Mekhala Krishnamurthy
September 30, 2021
The Agriculture Census for 2015-16 placed the number of “operational holdings” at 146.45 million. The farmer here is somebody cultivating land without necessarily owning it. The land may be a single piece or multiple plots owned or taken on lease; what matters is the entire area (“holding”) being managed (“operated”) by the same person (“cultivator”) alone or with others.
The National Statistical Office’s (NSO) recently released ‘Situation Assessment of Agricultural Households and Land and Livestock Holdings of Households in Rural India, 2019’ report has a different definition. The SAS doesn’t focus on operational holdings as the basic unit or on the number of farmers but identifies “agricultural households.” Agricultural households are defined as households having at least one member self-employed in farming and whose annual value of produce from such activity exceeds Rs 4,000. Farming or “agricultural activity” includes cultivation of crops (field, horticultural, plantation and fodder) as well as animal husbandry (dairying, poultry, goat/sheep-rearing, piggery, inland fishery, beekeeping, sericulture, etc.). Self-employment in agriculture can further be either in “principal” or even “subsidiary” status not less than 30 days during the survey reference period of six months (in this case, July-December 2018 for visit-1 and January-June 2019 for visit-2). India, as per this report, had 93.09 million “agricultural households” in 2018-19 (July-June) and 101.98 operational holdings. Of these, 89.58 million holdings were possessed by agricultural households, while 12.40 holdings were possessed by non-agricultural households (i.e., even if the plot was put towards some agricultural production, the household itself was not classified as agricultural by the definition above.
There might be a number of reasons that explain the huge variation—53.36 million – between the Agriculture Census’ and the NSO’s estimates.
The Agricultural Census is collected on a complete enumeration basis. This exercise involves re-tabulation of data from village land records that most states maintain for collating individual field and crop-wise area statistics. The NSO estimates of agricultural households, by contrast, are based on a survey design. The survey sample size for 2018-19 covered 58,035 households (45,714 agricultural) in visit-1 and 56,894 (44,770) in visit-2.
As long as some part of a plot of land has been used towards agricultural production, it is classified as an operational holding. The Agricultural Census begins with the status of the plot, whether it is owned by urban or rural, agricultural or non-agricultural households. The SAS begins with classifying rural households.
Members within a household may operate multiple holdings. While the Agricultural Census treats each of them as separate operational holdings, the NSO’s focus is on the agricultural household. All lands operated individually or jointly by all members of a household are taken as a single production unit or holding. So, if you used the Agricultural Census to estimate the number of farmers, you would consider each operational landholding as representing a farmer. But if you used the SAS, you would be working with the category of agricultural household, even though there might be more than one operational landholding and more than one ‘farmer’ residing in that household.
Given the expansive definition of “agricultural household” used by the SAS, it would follow that agricultural households would likely have multiple sources of income. In this note, we seek to try to understand what this data reveals in terms of the degree of dependance that agricultural households have on different sources of income, how this varies by land possessed and by state, and what the implications of this might be for agricultural, economic and social policy.
For this analysis, we consider net receipts (after deducting paid-out expenses) from crop production plus farming of animals as a percentage of the agricultural household’s total income from all sources. The latter includes income from wages/salary and leasing out of land, net receipts from non-farm business, and earnings from pension/remittance. A ratio above 50 per cent can be construed as significant agricultural dependence.
According to the SAS, the average total monthly income of an agricultural household in India during 2018-19 was Rs 10,829. Out of that, the share of farm income – Rs 3,798 from crop and Rs 1,582 from animal agriculture – was 49.7%. For the average agricultural household, the largest single-source of income was wages/salary (Rs 4,063). This has been cited by a number of analysts to conclude that the average Indian farmer is more of a labourer today (https://bit.ly/3i9Kws3).
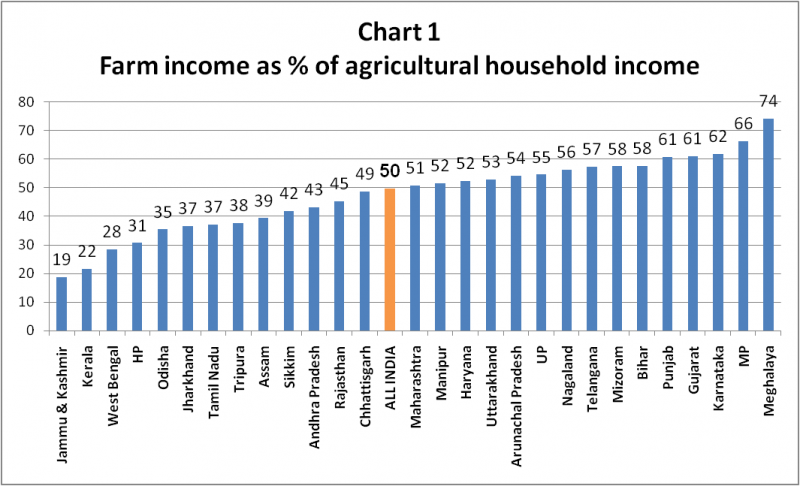
Any all-India average, though, hides considerable differences between states and also between landholding sizes. Chart 1 shows the average farming income dependence among agricultural households to be below a third or even a fifth in Jammu & Kashmir, Kerala, West Bengal and Himachal Pradesh, while amounting to over 50% for Maharashtra, Uttar Pradesh and Bihar, and crossing 60% in Punjab, Gujarat, Karnataka, Madhya Pradesh and Meghalaya. (A recent analysis suggests the Meghalaya data may require a closer look and that tasks remains to be undertaken).
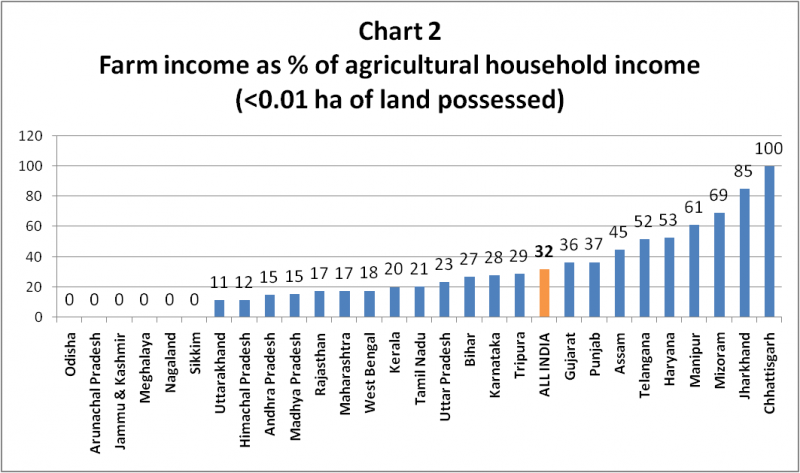
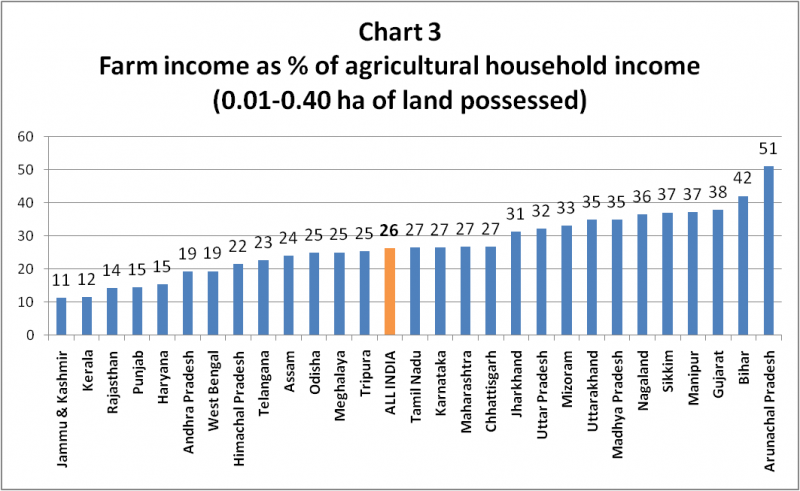
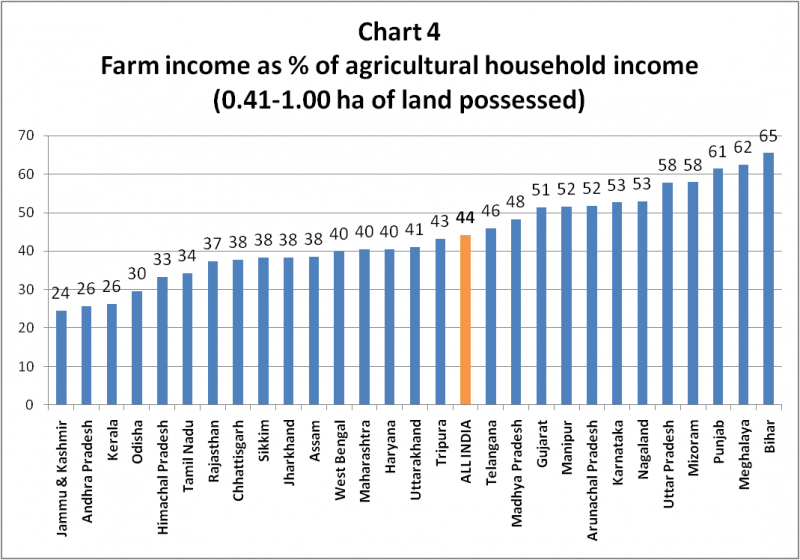
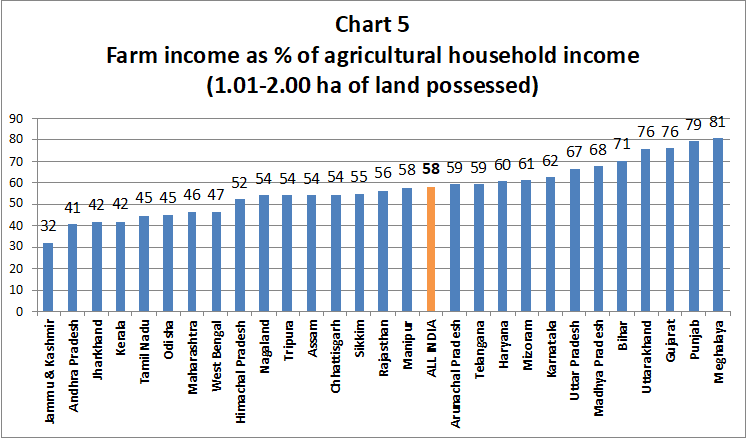
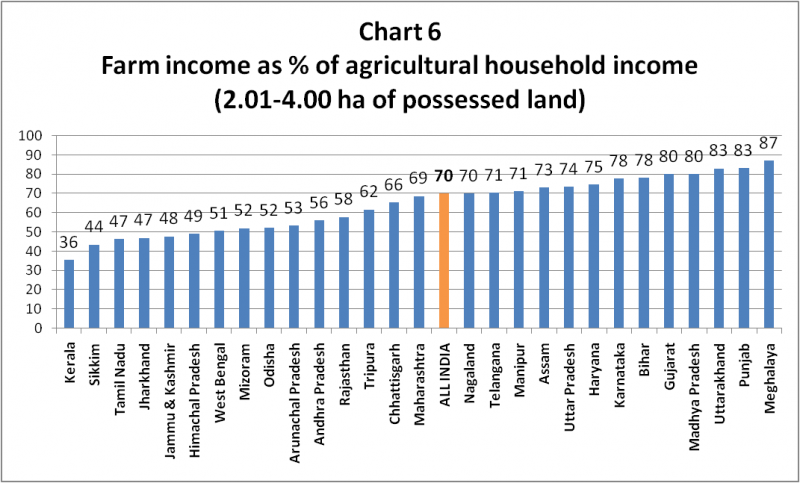
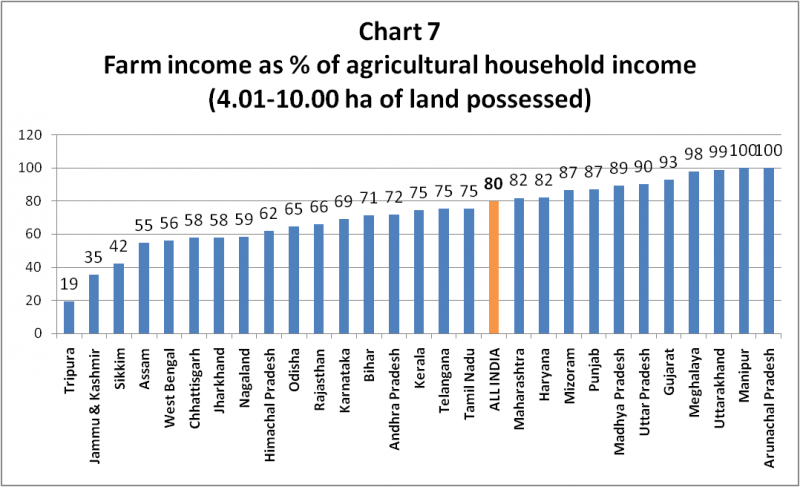
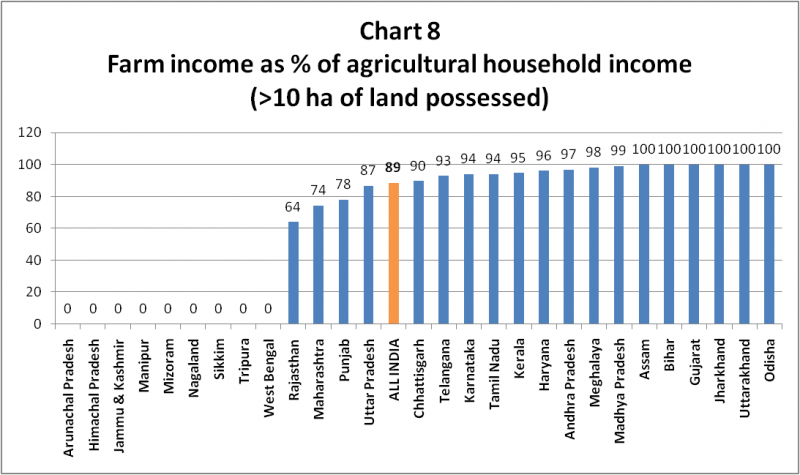
Farm income dependence is, moreover, a function of landholding size too. The following charts shows state-wise ratios of net farm receipts (from crop cultivation plus animal husbandry) to total agricultural household incomes across seven size classes of land possessed: <0.01 hectare, 0.01-0.4 hectare, 0.41-1 hectare, 1.01-2 hectares, 2.01-4 hectares, 4.01-10 hectares and above 10 hectares. “Land possessed”, it may be noted, is defined as land owned plus land leased-in minus land leased-out plus public/institutional land encroached upon without ownership/occupancy right. A farmer, by this definition, needn’t own any land. An agricultural household can “possess” land by growing crops or raising animals entirely on other’s land taken on lease.
What clearly emerges from our charts is that farming income dependence is less – between 26% and 44% at an all-India level – when holdings are one hectare and below. But the 50% threshold is surpassed thereafter, rising to 70% in the 2.01-4 hectares land possessed size class and almost touching 90% for above 10 hectares. The 50% threshold is crossed for a majority of states even when land possessed size exceeds one hectare. In the top two size categories – four hectares and above – income from farming contributes over 50 percent of all income for agricultural households in nearly all states. The variations across all charts are of course significant and striking, a point to which we will return later.
In terms of numbers, how many agricultural households in India are primarily dependent on farming income as the largest source of their overall household income?
The NSO Situation Assessment report has state-wise estimates of agricultural households for different size classes based on total land possessed. We have already worked out the ratios of farm income to total agricultural household income for all states across each of these size classes (Charts 2 to 8). Taking only those land size classes for which the farm income dependence ratios are 50% or higher, and adding up the corresponding estimated number of agricultural households, gives us a figure of farming income-dependent households in each state. For instance, Andhra Pradesh has 31.59 lakh agricultural households in all. But the 50% farm income threshold is crossed only for households having more than two hectares of possessed land. They number just 7.46 lakh, or 23.6% of the total agricultural households in the state.
Using the above methodology, we have calculated the number of significantly farming-income dependent households for all states. To repeat, agricultural households deriving a significant share of their income – 50% or more – from farming activity per se. It can be seen from the table below that this population is just over 36 million, which is approximately 39% of the total 93 million-odd agricultural households estimated by the NSO. It is, of course, even lower compared to the 146.5 million operational holdings in the country, as per the Agricultural Census for 2015-16. A previous estimate made by one of the authors of the present note had suggested that there are 47-50 million farmers that derive a significant part of their income from agriculture.
State-wise estimates of Farming income dependent farmers (in thousands)
| Farming income dependent
households |
Total agricultural households | % of Farming income dependant households | |
| Jharkhand | 6.6 | 2808 | 0.24 |
| Kerala | 8.1 | 1466.9 | 0.55 |
| West Bengal | 75.7 | 6626.2 | 1.14 |
| Jammu & Kashmir | 12.3 | 658.3 | 1.86 |
| Tamil Nadu | 60.3 | 2597.7 | 2.32 |
| Odisha | 283.7 | 4815.3 | 5.89 |
| Tripura | 25.3 | 289.3 | 8.75 |
| Himachal Pradesh | 140.5 | 1034.2 | 13.59 |
| Sikkim | 10.4 | 65.2 | 15.95 |
| Uttarakhand | 172.9 | 983.4 | 17.58 |
| Assam | 637.6 | 3099.7 | 20.57 |
| Andhra Pradesh | 745.5 | 3159.4 | 23.60 |
| Haryana | 710 | 1906.7 | 37.24 |
| Chhattisgarh | 1302.6 | 2985 | 43.64 |
| Rajasthan | 3267.4 | 7041.5 | 46.40 |
| Bihar | 3351.6 | 7011.3 | 47.80 |
| Madhya Pradesh | 3489.9 | 7276.3 | 47.96 |
| Uttar Pradesh | 8746.5 | 17789.5 | 49.17 |
| Maharashtra | 3646.6 | 7289.3 | 50.03 |
| Telangana | 1528.2 | 2668.5 | 57.27 |
| Punjab | 884.3 | 1473.8 | 60.00 |
| Gujarat | 2499.9 | 4037.1 | 61.92 |
| Manipur | 166.4 | 241.2 | 68.99 |
| Meghalaya | 272.2 | 364.7 | 74.64 |
| Karnataka | 3664 | 4251.6 | 86.18 |
| Mizoram | 71.5 | 76.4 | 93.59 |
| Nagaland | 181.6 | 191.8 | 94.68 |
| Arunachal Pradesh | 152.40 | 152.4 | 100 |
| ALL-INDIA | 36114 | 92360.7 | 39.1 |
Note: All-India figures are sum total of all states. The total agricultural households are slightly less than the 93.09 million given in the main NSO Situation Assessment report.
Policy conclusions and recommendations
This note has attempted to make a few key points. First, that estimates for the number of farmers in India based on available national statistical data varies depending on whether you count and base your assumptions on the number of “operational landholdings” or the number of “agricultural households.”
Second, as per the SAS 2019, among the 93 million agricultural households estimated to live in rural India in 2018-19, there is significant variation in the degree of dependence that households have on farming income. The degree of dependence varies across the size of landholding possessed. The NSO Situational Analysis report shows that the 50% farm income-to-total agricultural household income threshold is crossed at an all-India level only when the land possessed size exceeds one hectare or 2.5 acres. The fact is that 70% of agricultural households in the country do not possess even this minimum.
Third, this analysis of the SAS estimates that farming income contributes 50 percent or more of overall income for only 39 percent of agricultural households in India or approximately 36 million households. This may be thought of as the number of farmers who are able to make a living from agriculture, that is, make at least half or more of their living from farming. There are only ten states where this proportion is over 50 percent of the state’s agricultural households.
What are the policy implications emerging from this data and analysis?
Given the diverse role and place of agriculture in the lives and livelihoods of agrarian households and communities, it is not for us or for anyone else to conclude that the value of agricultural land or of farming can be simply equated with the amount or proportion of household income that it brings in. However, both the low levels of total household income and the very low earnings from farming for the vast majority of agricultural households is a harsh reality. Given the very small size of landholding possessed by most farming households, it is also a reality that most agricultural households are increasingly dependent on income from wages and other sources to meet their needs. This, then, is largely a process of distress-driven diversification. The reasons are structural and reflect deep problems with both the agricultural and non-agricultural economy.
Addressing these different, but interrelated challenges will require both much greater understanding of and investment in farming as livelihood and enterprise, as well as reimagining agriculture and rural livelihoods beyond the farm.
To start with, one must recognise that farming is a specialised and skilled economic activity and enterprise. We must not continue to keep treating it as a welfare sector or an endlessly absorptive residual/subsistence economy. Not everyone can, or need be a farmer. Agriculture policy should prioritise and support those for whom farming is their major source of income. This includes the design and delivery of Minimum support prices, government procurement, agricultural market reforms, infrastructure, irrigation, fertiliser and other input subsidies, Kisan Credit Card loans, crop insurance and export-import policies on farm commodities.
It is especially important to remember that farmers with sizeable operational landholdings, from which they earn the majority of their income, may not be the owners of that land. While India’s statistical data focuses on ‘operational’ holdings and land ‘possessed’, agricultural policy remains steadfastly attached to land ‘ownership’ as a primary criterion for many schemes, benefits and transfers to farmers. This disadvantages many risk-taking and entrepreneurial cultivators across the country. Even a scheme like Pradhan Mantri Samman Nidhi (PM-Kisan), which provides an income support of Rs 6,000 per year for some 110 million beneficiaries could be much more effectively designed and directed. This will help increase the quantum of support to those who need to be encouraged to remain in or expand their agriculture business. The ongoing protests against the Narendra Modi government’s agriculture reform laws are, perhaps, an expression of the accumulated frustrations and crises facing a prominent section of India’s farming-income dependent households, but they are by no means the only such farmers across the country.
What should be done for the 70% farm households that are mostly dependent on other income sources to eke out a living? Crop-based agriculture policy cannot obviously be the only or main answer. Livestock-based livelihoods are also very important here. Depending on the context, it is possible for even a one-acre farmer to rear five cows and sell 30 litres of milk daily from three at any given time, while dedicating her entire land to growing high-protein fodder crops. The same land can, alternatively, house a broiler farm with up to 10,000 birds and six batches being sold in a year. There are likely to be other, agroecologically and economically better strategies that need to be prioritised.
Further, there is also likely to be significant scope for value-addition and employment outside rather than on the farm as well – be it in aggregating, grading, packaging, transporting, processing, warehousing and retailing the produce, not to speak of supply of agri-inputs, machinery and other services to farmers. All these activities fall within the realm of agriculture, even if outside the farm. Agriculture policy should aim at not only increasing farm incomes, but also adding value to produce outside and closer to the farms. Finally, these will necessarily have to be state-specific and within them region and location-specific strategies that locate rural households at the centre of a larger vision for agricultural and economic development. Policies, moreover, that better understand farm/non-farm interlinkages and better support and enable the necessary and challenging processes and dynamics of diversification on and off the farm.
This note, part of the Understanding the Rural Economy series by CPR, has been authored by Harish Damodaran, Mekhala Krishnamurthy and Samridhi Agarwal.
Find all previous notes as part of the series here:
- Can rural play “savior” again? Agricultural seasons and COVID-19 waves by Mekhala Krishnamurthy and Harish Damodaran
- How ‘food’ has become the real social safety net in pandemic by Harish Damodaran
- Where is food inflation headed? by Harish Damodaran
- Has MGNREGS Helped the Rural Economy in 2021? by Yamini Aiyar, Avani Kapur and Harish Damodaran
- Employment U-turn: Rural India is India’s main employer by Harish Damodaran and Yamini Aiyar
- Carbohydrates to proteins and back: How dietary and cropping diversification seems to have gone into reverse by Harish Damodaran, Mekhala Krishnamurthy and Samridhi Agarwal.
- Mapping India’s livestock economy by Harish Damodaran and Samridhi Agarwal.
- Unlocking the potential of Ganna Pradesh
- The Future of MSP by Harish Damodaran