 Source: National Accounts Statistics
Table 1 gives the share of livestock in the farm incomes (from cultivation of crops as well as animal husbandry) of agricultural households for different states and all-India.
Table 1: Income from animal husbandry as % of total farm income
| 2012-13 | 2018-19 | |
| Meghalaya | 9.22 | 3.84 |
| Chhattisgarh | 0 | 10.78 |
| Telangana | 8.13 | 12.25 |
| Mizoram | 15.93 | 16.76 |
| Karnataka | 10.85 | 19.57 |
| Odisha | 48.29 | 20.96 |
| Kerala | 14.00 | 22.40 |
| Madhya Pradesh | 15.42 | 23.11 |
| West Bengal | 18.69 | 23.11 |
| Maharashtra | 12.26 | 24.49 |
| Tripura | 10.09 | 24.79 |
| Sikkim | 36.62 | 25.29 |
| Assam | 15.95 | 25.56 |
| Punjab | 13.24 | 26.13 |
| Uttar Pradesh | 15.98 | 29.32 |
| Haryana | 25.16 | 30.66 |
| Uttarakhand | 25.10 | 38.42 |
| Rajasthan | 23.56 | 38.71 |
| Bihar | 13.99 | 38.83 |
| Himachal Pradesh | 26.69 | 41.51 |
| Andhra Pradesh | 34.71 | 42.80 |
| Jharkhand | 45.12 | 42.87 |
| Tamil Nadu | 36.46 | 43.09 |
| Gujarat | 39.69 | 44.61 |
| Arunachal Pradesh | 16.46 | 44.63 |
| Manipur | 34.83 | 44.90 |
| Jammu & Kashmir | 20.73 | 53.48 |
| Nagaland | 30.11 | 65.41 |
| ALL-INDIA | 19.85 | 29.41 |
Note: Income refers to net receipts after deducting paid-out expenses; Total farm income includes net receipts from crop production plus farming of animals.
Source: SAAH reports for 2012-13 (NSS 70th Round) and 2018-19 (77th Round).
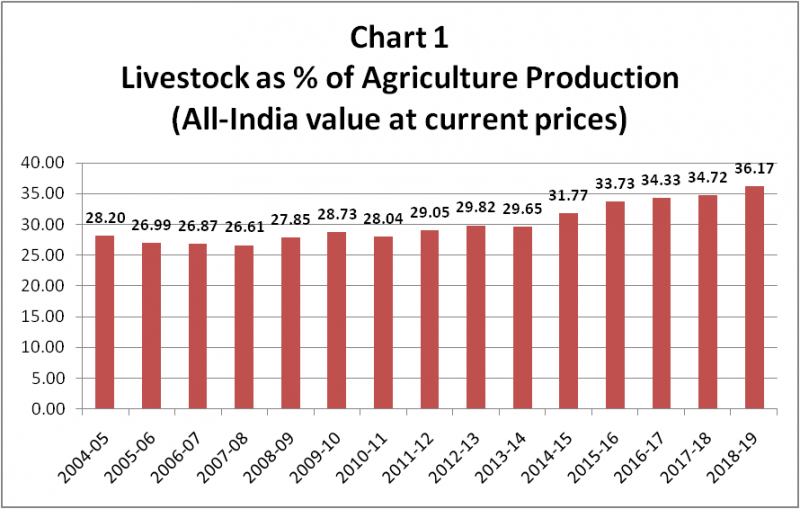
It can be seen that livestock’s contribution to farm income at all-India level as per the SAAH surveys (29.4% for 2018-19) is lower than its share in agriculture production (36.2%) based on the NAS. Being survey-based, the SAAH data is likely to be more reliable than official production estimates. The latter have been called into question, particularly in respect of milk (https://bit.ly/3lylyVo). Table 2 shows that the average annual production growth of 6.3% estimated by the Department of Animal Husbandry & Dairying (DAHD) during 2015-16 to 2019-20 has exceeded the 3.5-4% yearly increase in liquid milk sales of cooperatives and inflation-adjusted turnover of leading private dairy companies for this period (Table 2).
Table 2: Milk production vs. Sales by organised dairies
| Milk
Production (million tonnes) |
Liquid milk marketing by coops* | Sales of major private dairies** | |
| 2014-15 | 146.314 | 312.41 | 16,573.41 |
| 2015-16 | 155.491 | 321.28 | 16,898.96 |
| 2016-17 | 165.404 | 330.82 | 19,328.22 |
| 2017-18 | 176.347 | 349.54 | 20,457.08 |
| 2018-19 | 187.749 | 358.09 | 21,561.97 |
| 2019-20 | 198.440 | 370.77 | 23,885.13 |
| Average % growth | 6.28 | 3.49 | 7.67@ |
Note: *lakh litres per day; **For 12 large dairy companies in Rs crore; @Unadjusted for inflation. Annual consumer inflation in milk & dairy products averaged 3.6% during 2015-16 to 2019-20.
Source: DAHD, National Dairy Development Board and company results.
But even a 29.4% share of livestock in farm income for 2018-19 is a significant jump from the 19.9% levels only six years ago. From Table 1, it can be seen that in as many as nine states, livestock generates more than 40% of the incomes of agricultural households from farming. This might not be surprising for a state like Gujarat, where the district cooperative unions affiliated to ‘Amul’ procure roughly half of its entire estimated milk output. Nor should it for Tamil Nadu, which is home to India’s largest private sector dairy (Hatsun Agro Product), broiler enterprise (Suguna Foods) and also “egg capital” (Namakkal). Like with Gujarat, organised dairies handle nearly half of Tamil Nadu’s milk production. More than two-thirds of that, though, is accounted for by private dairy companies, as against the near-monopoly enjoyed by the Amul-affiliated cooperatives in Gujarat. Andhra Pradesh is another state with a strong dairy as well as poultry industry (it has, since 2017-18, even overtaken Tamil Nadu as India’s No. 1 egg producer).
What is equally striking about livestock’s share in farm income is that it is higher among smallholders – agricultural households possessing less than one hectare of land. For households in the lowest size classes (below 0.40 hectares or one acre), the net receipts from farming of animals are even more than from cultivation of crops (Table 3).
Table 3: Livestock’s share of farm income by land size (Rs/month)
| Land size class (hectares) | Net receipts from crop production
(1) |
Net receipts from farming of animals (2) | Total Farm income
(3) |
(2) as % of (3) |
| <0.01 | 1,660 | 2,084 | 3,774 | 55.66 |
| 0.01-0.40 | 977 | 1,162 | 2,139 | 54.32 |
| 0.41-1.00 | 2,683 | 1,335 | 4,018 | 33.23 |
| 1.01-2.00 | 5,269 | 1,845 | 7,114 | 25.93 |
| 2.01-4.00 | 9,432 | 2,551 | 11,983 | 21.29 |
| 4.01-10.00 | 19,645 | 3,451 | 23,096 | 14.94 |
| 10.00+ | 43,599 | 11,473 | 55,072 | 20.83 |
| All sizes | 3,798 | 1,582 | 5,380 | 29.41 |
Source: SAAH report for 2018-19 (77th Round).
One reason for livestock farming contributing a higher share of income for marginal agricultural households is that it is a more labour– than land-intensive economic activity. Land ownership in rural India is rather iniquitous: According to the SAAH report for 2018-19, 84.7% of rural households have holdings of less than one hectare and they together account for just 34.5% of the total area owned. The same report, however, shows ownership of livestock to be more equitably distributed. For instance, 30% of rural households in the lowest operational holding size class of 0.002-0.005 hectares own milk-producing cows, which is as much as that for those with 3-4 hectares. The average number of in-milk cattle owned per 100 households for this virtually-landless holding class, at 33.4, isn’t also much below the 44.9 for those having 3-4 hectares. The ownership is even more equitable in the case of ovine (sheep/goat) and poultry birds – households with less land tend to keep more of these – although not as much as with buffaloes (Table 4).
Table 4: % of rural households owning livestock & number (N) of livestock per 100 households
| Size class of operational holding (ha) | In-milk cattle | In-milk buffalo | Ovine | Poultry birds | ||||
| % | N | % | N | % | N | % | N | |
| 0.002-0.005 | 30.0 | 33.4 | 13.8 | 17.7 | 43.4 | 267.5 | 17.8 | 178.6 |
| 0.005-0.040 | 26.9 | 37.4 | 19.3 | 25.6 | 34.3 | 473.3 | 14.2 | 108.3 |
| 0.040-0.5 | 20.5 | 25.4 | 11.7 | 14.5 | 28.6 | 173.4 | 13.9 | 116.3 |
| 0.5-1.0 | 26.4 | 34.8 | 17.0 | 23.0 | 28.9 | 195.3 | 16.1 | 134.7 |
| 1.0-2.0 | 28.0 | 39.6 | 21.3 | 30.3 | 27.3 | 237.0 | 14.3 | 179.4 |
| 2.0-3.0 | 30.9 | 46.5 | 25.9 | 40.6 | 22.5 | 197.7 | 10.8 | 118.6 |
| 3.0-4.0 | 30.1 | 44.9 | 34.8 | 52.5 | 21.7 | 149.8 | 7.2 | 65.3 |
| 4.0-5.0 | 41.8 | 74.3 | 34.8 | 65.0 | 23.6 | 187.0 | 9.9 | 94.3 |
| 5.0-7.5 | 46.8 | 75.8 | 35.6 | 59.2 | 15.6 | 428.2 | 6.4 | 325.8 |
| 7.5-10.0 | 49.7 | 73.7 | 44.1 | 79.0 | 26.3 | 260.2 | 6.0 | 58.7 |
| 10.0-20.0 | 48.4 | 79.2 | 41.2 | 66.3 | 23.4 | 241.2 | 6.0 | 76.6 |
| >10.0 | 36.4 | 80.5 | 90.0 | 168.2 | 26.1 | 309.0 | 16.2 | 224.7 |
| All sizes* | 16.4 | 21.9 | 10.7 | 14.8 | 21.9 | 188.8 | 10.7 | 133.9 |
*Includes landless households.
Source: SAAH report for 2018-19.
The viability of livestock rearing over regular crop agriculture for smallholders has been best demonstrated in dairying, more so in states with well-developed milk procurement and marketing systems. The best example of it is, perhaps, the Valsad district union of Amul. This Rs 1,850 crore-turnover union procures an average 8.5 lakh kg per day of milk from its 1.22 lakh producer-members, almost two-thirds of them adivasis. These largely first or second-generation dairy farmers typically keep about three adult milch animals – the first one a freshly-calved cow giving 10-12 litres daily, the second 5-6 months pregnant producing 3-4 litres and the third about 8 months already gone dry. The last animal would, then, calve just when the second one stops lactating. In this way, the farmer is able to sell 15-16 litres daily round the year.
In areas where organised dairies undertaking direct procurement exist, a one-acre farmer can even dedicate her entire land to grow high-yielding protein-rich fodder hybrids/varieties and rear 5-6 crossbred cows. Feeding this multi-cut/perennial green grass would not only meet the base crude protein requirements of these animals (and their calves/heifers), but also reduce purchases of expensive compound cattle feed/concentrates that need to given only when they are producing milk.
Hybrid broiler technology has, likewise, turned poultry farming into a commercial enterprise even for smallholders. Modern broiler hybrids grow from 35-40 gm chicks to 2-2.5 kg live birds within 40-45 days, as against the traditional free-range/backyard breeds that take 12-16 weeks to attain slaughter weight. A broiler farm, again, requires little land. One acre can easily accommodate 10,000 birds and six batches sold in a year.
The viability of both dairy and poultry, however, rest on three factors. The first is capital. Good crossbred cows and Murrah buffaloes cost upwards of Rs 50,000-60,000. The investment requirement even for a 2,000-bird broiler farm – inclusive of poultry shed, equipment and cost of day-old chicks, feed, medicines and vaccines in the first cycle – would be at least Rs 8 lakh today. That obviously calls for bank loan access or even subsidy, which some states are offering at up to 40% of project cost (https://bit.ly/3DA0Ydx).
The second market access. The Amul model in dairying or the Suguna contract farming integration model in poultry (https://bit.ly/3FFVLmn) basically provide market linkages for producers. Assured offtake along with some minimum guaranteed price is important for any farm produce. In this case, it relates to produce that needs to be sold daily or six times in a year. The farmer’s capital cost recovery and return on labour are a function of both liquidity (being able to sell each time) and price received.
The final point relates to consumption. Demand for animal proteins and fat is part of the normal dietary diversification that comes with rising household incomes. Data from past National Sample Survey rounds have pointed to a significant diversification of consumption – from merely calories/energy-based foods to those incorporating proteins and micronutrients – taking place during the high growth phase of the Indian economy from 2004-05 to 2011-12. A previous note in this series had suggested a stalling or even reversal of this accelerated trend of diversification (https://bit.ly/3lDJO8S). That, of course, has implications for demand and sustained growth of the most dynamic – and possibly, poverty-alleviating – segment of Indian agriculture.
This note, part of the Understanding the Rural Economy series by CPR, has been authored by Harish Damodaran and Samridhi Agarwal.
Find all previous notes as part of the series here:
- Can rural play “savior” again? Agricultural seasons and COVID-19 waves by Mekhala Krishnamurthy and Harish Damodaran
- How ‘food’ has become the real social safety net in pandemic by Harish Damodaran
- Where is food inflation headed? by Harish Damodaran
- Has MGNREGS Helped the Rural Economy in 2021? by Yamini Aiyar, Avani Kapur and Harish Damodaran
- Employment U-turn: Rural India is India’s main employer by Harish Damodaran and Yamini Aiyar
- Agricultural Households and Farming Income: An initial analysis of variations in income from farming and other sources among agricultural households in India by Harish Damodaran, Mekhala Krishnamurthy and Samridhi Agarwal
- Carbohydrates to proteins and back: How dietary and cropping diversification seems to have gone into reverse by Harish Damodaran, Mekhala Krishnamurthy and Samridhi Agarwal.
- Unlocking the potential of Ganna Pradesh
- The Future of MSP by Harish Damodaran
- The Return of Food Inflation: Why its Different this time by Samridhi Agarwal and Harish Damodaran