As Budget 2017 was announced by the Union government on 1 February, find below a curated analysis by CPR faculty.
Pratap Bhanu Mehta writes in The Indian Express that through this budget the government is trying to steady the ship after the demonetisation shock, explaining how it ‘is an exercise in forward-looking but cautious prudence’.
In an article in Hindustan Times, Rajiv Kumar writes that the budget is what the ‘doctor ordered for the economy’, as it addresses the critical tasks of ‘generating employment, promoting private investment, pushing up consumption, improving delivery of subsidies and public services’. He further writes in The Hindu on how the budget fulfills the three principle goals of reviving domestic investment; generating employment opportunities; and cleansing the economy of black money flows.
Yamini Aiyar writes in Livemint and in a Hindi article in Amar Ujala that the budget has maintained the status quo, as far as social sector schemes are concerned, and has been ‘remarkably silent’ on restructuring the ‘financing architecture for social policy post the 14th Finance Commission’. Avani Kapur reiterates this in another article in Deccan Herald, writing that despite riding high on expectations, Budget 2017 did not offer any major changes in majority of social sector schemes.
Kiran Bhatty writes in The Wire that the ‘attention deficit’ towards education remains unchanged in this year’s budget.
Sanjaya Baru and Rajiv Kumar also debate the budget on CNN News18 and Times Now (above) respectively.
In situations marked by grave injustice, fear, loss and confusion, affected communities articulate their grievances and seek out institutions to address them through remedies that are meaningful to them. The process of seeking remedies by affected communities helps not only to politicise questions of democratic decision making and land governance but also improves land and project governance outcomes. They take on the role of asking questions, monitoring and seeking accountability in a hostile environment of risk of intimidation and criminalisation. People affected by land use change seek a variety of remedies for the impacts they face. While some of these are towards short-term relief and one time payments/aid, others are towards long-term participation in projects. Some seek complete closure/suspension of projects, others are towards remedying the harms caused by ongoing projects or putting in systems in place to prevent further damage to their environment and livelihoods.
Using the above categorisations, this blog discusses key remedies that have been sought in the countries of India, Indonesia and Myanmar.
One-time assistance: compensation and better relocation
i. Compensations are sought by the affected people in return for the land acquired, and/or livelihood lost, as a one-time payment prior to the setting up of the project. In case of the Thilawa Special Economic Zone (SEZ) in Myanmar, while its first phase has started, communities’ expectation from the project have changed: initially they were refusing to relocate, then they switched to seeking better relocation facilities, now the group is preparing and organising itself to run a community driven organisational grievance mechanism. Simultaneously the farmers who know they would be relocated for the second phase are thinking how much compensation would they demand and strategising and organising on this expectation.
Compensations are also sought when project operations directly or accidentally damage water resources and/or farms or reportedly cause health impacts. The challenge arises when the affected people seek compensations from either the administration or the company. In the Uttara Kannada district of Karnataka, the construction of a National Highway is presently underway. Following a series of complaints and meetings with the Pollution Control authorities, the company operating a stone crusher for the project in Bogribail village, paid compensation to affected farmer families in December 2016. The affected people felt that this was far from adequate as the stone crusher continued to emit dust and damage their farmlands.
Despite the routine use of compensation as a way to remedy impacts borne by communities, it has been observed that across the countries, communities have little or no information how the compensation is to be calculated, how to assess if what they are getting/demanding is fair.
ii. Relocations are ideally provided prior to project start but the quality of relocation sites continue to be a festering issue for communities even after projects start operations. The case of Thilawa from Myanmar offered an interesting example. The Thilawa Social Development Group (TSDG) formed by the farmers who had to vacate their land for the first phase of the project made a visit to the relocation site for Dawei SEZ and saw the difference between what they were being offered and what Dawei evacuees were getting. They made a demand with the Japan International Cooperation Agency (JICA) for better compensation and improved basic amenities at the relocation site. While JICA increased the compensation to the farmers, not much improvement was seen in their living conditions.
Continued participation in project through financial stakes and benefit sharing
In Indonesia, it has been observed that in many cases of land conflicts, farmers opposing land takeover by plantation companies are offered plasma agreements as ‘fair’ remedy for their concerns. However, beyond the stipulation that the companies are expected to reserve 20% of their total plantation area for smallholders and provide them technical assistance in oil palm cultivation, plasma agreements are not governed by much. Usually a farmer cooperative enters into an agreement with the company. The farmers give a minimum of ten hectares of land for plasma to the company, become a part of the cooperative and receive share certificates for two hectares of plantation each. In most cases, cooperatives come to be managed by the office bearers of the village or others with might or money. Although on paper the cooperative has the autonomy to develop and manage plasma, in practice, decisions regarding land allocations, recruitment of labour and sales price of the palm fruits are made by the company.
Another example of taking part in the development activity is of Korba Bhuvistapit Company Limited from India. In the Korba coal-mining region in Chhattisgarh, over 2400 families who have been displaced but have not been provided jobs have come together to form this producer company. The main objective of the company is to demonstrate that communities can undertake activities including transportation, plantation and renewable energy and to maintain moral pressure on South Eastern Coalfields Limited (SECL) to provide opportunities for ancillary activities to the displaced members.
Partial or full closure of project
People affected by land use change also approach different institutions or use a variety of strategies that are clearly directed towards closing down the construction or operations of an existing project. This is often the case in two instances: first, when a project has recently initiated construction activity, and there appear to be possibilities of holding back land use change; and second, when several attempts at seeking compensations, employment or restoration of damage have failed and/or the project continues to impact the health/livelihoods of communities living in the nearby areas.
i. Project suspension: One of the landmark cases from India where few villages affected by the proposed land use change by a steel plant and port consistently demanded that the project’s construction activity not be initiated was the POSCO steel plant and port in Jagatsinghpur, Odisha. Every time the project authorities would initiate activities, there would be strong local protests and barricading disallowing the construction activity. Challenging the project approvals in court with the help of national NGOs and lawyers was the other strategy so as to hold back land use change.
Sometimes these demands for suspension of projects arise due to the non-participatory manner in which decisions are made. In case of Tarpein I and II dams in Kachin State of Myanmar, the Kachin Independence Organisation (KIO) deployed soldiers around the two dams and suspended their construction work when the Chinese authorities of China Datang Corporation (CDC) company refused to pay taxes to KIO. KIO also complained that local residents were not given any role in decision-making on these projects.
ii. Revocation of permits has been sought in cases of environmental degradation caused by mining in Jambi province of Indonesia. Pursuing this remedy, the communities along with other efforts, reported the cases to the Anti-corruption commission (KPK) in the hope that it would investigate the issue and eventually order suspension of their permits. As part of its investigation, the anti-corruption commission visited these mining sites. However, only one project has seen closure.
In case of the sulphuric acid factory near Letpadaung mine in Sagaing Region in Myanmar, the villagers demanded complete closure/relocation of the factory due to the dangers associated with toxic fumes emitted by it. While some cases see a change in people’s demands for remedies over time, in Myanmar, hydro and thermal power projects have been in suspension for a long time perhaps due to persistent demands.
Repatriation of land
This demand is made when a project has withdrawn from an area, and the affected people would like the land back to restore livelihoods, e.g. POSCO in Jagatsinghpur. After the private company has withdrawn from the project, the state government is seeking to build a wall around the land to protect it from ‘encroachments’. The villagers are demanding that the land be restored to all the forest dwellers whose rights are yet to be recognised under the The Scheduled Tribes and Other Traditional Forest Dwellers (Recognition of Forest Rights) Act, 2006. More recently, the demand for this remedy has also been fuelled by the existence of a new legal clause as part of the 2013 Land Acquisition Law
Sometimes, after repatriation of land reverting to the original land use is not possible. In such cases communities pursue possibilities of owning the altered land use activities for their livelihood. This remedy can be a follow up to closure of a project and return of their land. In the case of PT Rejeki Alam Semesta Raya (RASR), active in Kapuas regency of Central Kalimantan in Indonesia, farmers of Sei Ahas village were pursuing the return of their land right from the beginning of the conflict in 2007. The lands were collectively held rubber plantations, which were turned into oil palm plantations by the company. While the group of farmers that demanded the return of their land shrank over the years as many accepted plasma agreement after their initial opposition, a group of 20 farmers continued with their initial demand. The farmers want the company to rescind its claim on the land and plantation so they can harvest the oil palm.
Restoration
This remedy is usually observed in cases of environmental degradation or damage to land caused by dumping of waste or extraction due to mining operations. This remedy could be followed by closure/suspension of a project or a commitment by the project not to contaminate the land/water again. For instance, in several parts of India where sand mining has led to erosion or salinity ingress, people have sought that the activity be stopped and the area be restored.
In the case of activities of BNJM-KGLR in East Barito in Central Kalimantan, Indonesia, the villagers sought the restoration of the river that was heavily silted due to dumping of mine refuse by the company, to its original condition. The farmers also sought compensation for the damage they incurred in the past when the mud from the river ended up on their rubber plantations and left their crops dead. When asked if farmers would be in agreement if the company continued to pay for damages in the future while continuing to pollute the river, many didn’t reply in the affirmative. The villagers of Lalap and Bentont villages wanted the company to restore the river and abide by environmental laws in future.
Proactive measures as remedies
The demand for closure of a plant is often a big challenge for the affected people who are directly dependent on the plant for livelihoods. In such cases the remedies sought are towards making sure that the operations do minimum/no damage. They may want an assurance that the project would not be expanded in future, or compliance record of the project would be part of any future project decisions or policy changes such as communities are granted effective role in project monitoring. Realising that the land use change is unavoidable, they may even want to own the changed land use activity. This can be viewed as a proactive measure on part of communities to offer an alternative to private/government owned projects.
In India, villagers in Tamnar block of Raigarh district of Chhattisgarh registered their own firm and called it Gare Tap Upkram Producer Company. The idea behind establishing the firm was to mine the coal themselves rather than surrendering their land to industrialists. More than 500 villagers from 12 adjoining villages of Gare had pledged nearly 700 acres of land to the producer company. As they deliberated further on the issue of mining, the villagers decided against mining altogether and instead proposed setting up of production of alternate energy so that the land is not devastated by mining. The Gare Tap Upkram Producer Company has subsequently approached the Environics Trust, a national NGO, and requested it to conduct a study on the feasibility and willingness of the inhabitants of Gare in adopting alternate sources of energy, predominantly in solar and biogas energy.
In case of the Tigyit coalmine in Shan state of Myanmar, although the residents made peace with the operation of the mine, which has been operating in the area for nearly 20 years, their demand is that the project not be expanded. The residents spent their energies in resisting a thermal power plant to be cited next to the mine and were successful in suspending the plant. They opine that if the thermal power plant doesn’t run, the mine would not be given an expansion by the government. However, after being shut for two years, talks for the resumption of the thermal power plant are on and the villagers are bracing themselves to resist it again. As of end of 2017, test runs on the plant were being conducted and the government maintained that the plant will not be allowed if it is found to be linked with harmful impacts on health and livelihoods of the residents of Tigyit village in Shan state.
There are several remedies or outcomes that the affected communities succeed at getting. The study, Understanding Land Conversion, Social Impacts and Legal Remedies in Asia, through the country reports and the case studies, demonstrates that although these are mostly only limited successes, they surely are positive stories of collective agency and change. Albeit small, communities who struggle to get them view these as important victories.
This is the third blog based on the study carried out by the CPR-Namati Environmental Justice Program, supported by a grant from the International Development Research Centre, Ottawa, Canada.
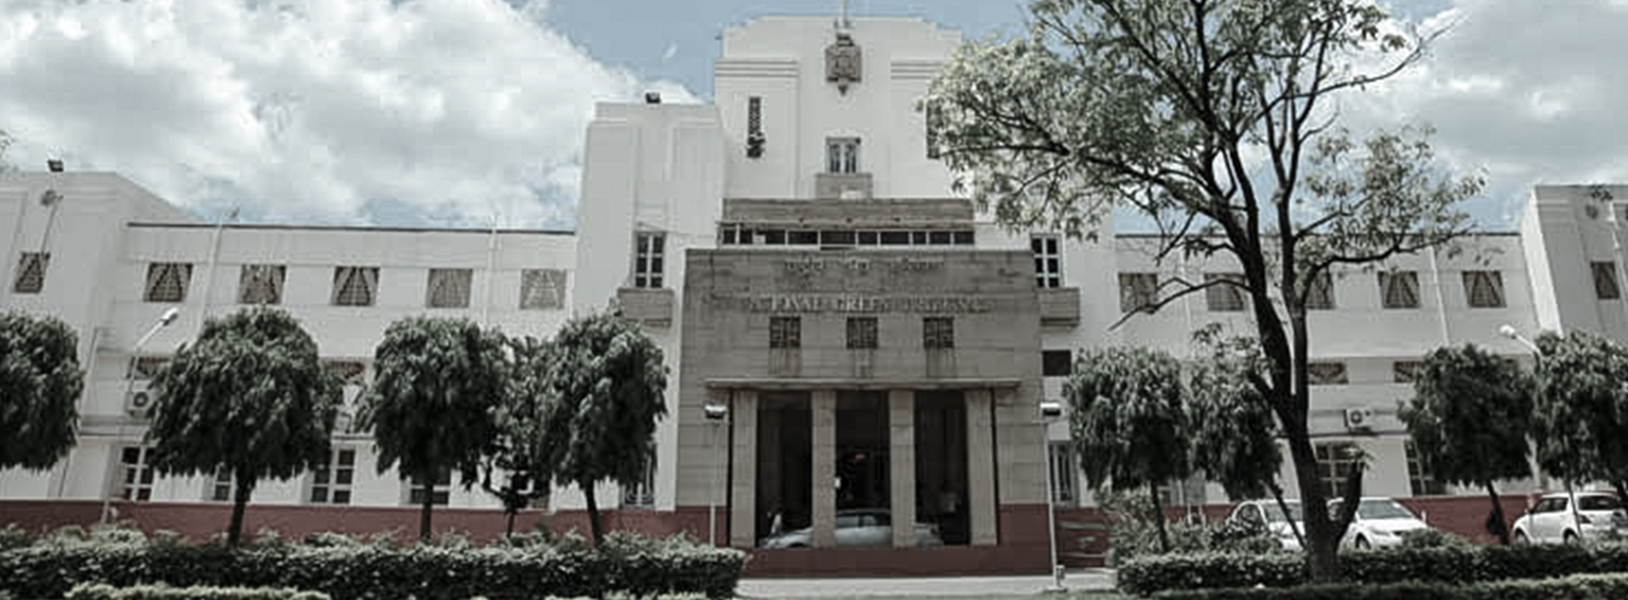
The National Green Tribunal (NGT) has emerged as an important player in Indian environmental regulation. It has issued orders on a variety of issues–ranging from pollution to deforestation to waste management. It recently directed the Delhi government to de-register all diesel vehicles more than 10 years old–a decision being opposed by many stakeholders, including the Central Government.
In the interview below, environmental lawyer and CPR faculty Shibani Ghosh talks about the National Green Tribunal and it’s functioning. Shibani practices before the National Green Tribunal and has written on various issues of domestic environmental law and governance. She is currently editing a book on key principles of Indian environmental law.
Can you tell us about why and how was the NGT established?
The need to set up special environmental courts was highlighted by the Supreme Court of India in a series of judgments, the first one being in 1986 in the Oleum Gas Leak case, and by the Law Commission of India in its 186th report in 2003. The Court was of the opinion that environmental cases raised issues, which required technical knowledge and expertise, speedy disposal, and continuous monitoring, and therefore these cases should decided by special courts with necessary expertise and technical assistance.
The Parliament passed the National Environmental Tribunal Act, 1995 but it was never implemented. Subsequently, the National Environment Appellate Authority Act, 1997 was enacted under which the National Environment Appellate Authority was set up. There were several problems in the functioning of the Authority, including its limited mandate and key vacancies that the government did not fill. The Authority functioned till October 2010 and was replaced by the National Green Tribunal.
The National Green Tribunal was set up under the National Green Tribunal Act, 2010 (NGT Act). The objective of the NGT Act is to provide effective and expeditious disposal of cases relating to the protection of the environment. Even though the Act came into force on 2 June 2010, the first hearing of the Tribunal was held only in May 2011. The Tribunal suffered from serious ‘teething troubles’. Despite being a body constituted by an Act of Parliament, the Supreme Court had to intervene to ensure necessary administrative arrangements were made by various branches of the government for the Tribunal to become functional.
How does the Tribunal function?
The members of the Tribunal are a mix of persons with a legal/judicial background and those with knowledge and expertise in environmental issues or with administrative experience. There is a principal bench of the Tribunal in New Delhi and four regional benches in Bhopal, Kolkata, Pune and Chennai. These are ‘co-equal benches’ i.e. the principal bench is not ‘higher’ in a judicial hierarchy than the other benches. Each bench has a specified geographical jurisdiction. For instance, cases arising from Kerala, Tamil Nadu, Karnataka, Andhra Pradesh, Pondicherry, and Lakshadweep have to be filed in the Southern bench in Chennai. Occasionally ‘circuit benches’ are also constituted. These are specially constituted benches, which visit a particular city for a few days to hear cases relating to that state.
The Tribunal has original (to be the first judicial forum to hear a case) and appellate (review a regulatory authority’s decision) jurisdiction with regard to the implementation of seven environmental laws. These are the Water (Prevention and Control of Pollution) Act, 1974, the Water (Prevention and Control of Pollution) Cess Act, 1977, the Forest (Conservation) Act, 1980, the Air (Prevention and Control of Pollution) Act, 1981, the Environment (Protection) Act, 1986, the Public Liability Insurance Act, 1991, and the Biological Diversity Act, 2002. The notable exception is the Wildlife (Protection) Act, 1972 which is not included. A significant number of cases that may arise under the Wildlife (Protection) Act are criminal cases–and the Tribunal has no jurisdiction over criminal cases.
The Tribunal has original jurisdiction over all civil cases raising a substantial question relating to environment and which arise out of the implementation of the seven laws. This makes the Tribunal a crucial avenue for grievance redressal for persons who wish to highlight environmental issues which have serious implications but are not linked to a single government decision.
For instance, cases relating to the widespread pollution in the River Ganga and Yamuna, increasing air pollution in the National Capital Region, and illegal mining activities in different parts of the country have all been brought before the Tribunal under its original jurisdiction.
While exercising its appellate jurisdiction, the Tribunal decides cases in which a regulatory approval or consent granted (or rejected) by the relevant government agency is being challenged. These approvals or consents are those issued under the seven laws. For example, environmental clearances under the EIA Notification 2006, forest clearances under the Forest (Conservation) Act, and consents issued by the State Pollution Control Boards under the Water Act and the Air Act are included.
Who can approach the NGT?
According to the NGT Act, an aggrieved person can file a case before the Tribunal, and could be an individual, a company, a firm, an association of persons (like an NGO), even if not registered or incorporated, a trustee, a local authority (like a municipal corporation), or a government body (like the State Pollution Control Board). The person need not be directly affected by the project or development in question, but could be any person who is interested in protecting and preserving the environment. There is a time period within which the case has to be brought before the Tribunal, which varies according to the type of case.
What kind of decisions can the NGT deliver, and what is the timeline?
The Tribunal has the power to cancel an approval or consent granted. It can also issue a stop work notice or an interim stay order. It can direct the constitution of a committee of experts to carry out fact finding or monitor the implementation of its orders; and direct concerned government agencies to take affirmative action to prevent or mitigate environmental damage. It can also direct the demolition of unauthorized construction. The Tribunal also has jurisdiction to order payment of compensation to victims of environmental damage or an environmental restoration fine to a government agency for restitution of damaged environment.
The NGT Act requires the Tribunal to hear cases as expeditiously as possible and endeavour to decide the case within six months from the date on which the case is filed. Despite this indicative timeline, it often takes longer as all parties have to be heard and allowed to present necessary evidence, and sometimes, the Tribunal initiates special investigations into facts, which may take up additional time.
Is the verdict of the NGT binding?
The decision of the NGT is binding on the parties, unless they approach the Supreme Court in appeal and the NGT’s order is either stayed or reversed. Failure to comply with the orders of the Tribunal could lead to a fine or imprisonment of the person responsible.
You can read more about Shibani Ghosh’s work on the National Green Tribunal below:
The current government’s steady push on digitising governance follows decades of such interventions. A new Accountability India series chronicles the experiences of former senior bureaucrat TR Raghunanandan on what it has taken to implement a system-wide change, and where the gaps have been.
In ‘Wither, e-Governance’, Raghunanandan asks the crucial question of whether innovations in e-Governance will indeed make the government more responsive and accountable to the people.
In thesecond part of the series, he talks about the introduction of desktop computers in government offices and how the transition began with only some officials understanding the full potential of this new technology in increasing efficiency. In ‘Spreading Spreadsheets’, he goes on to recount the value of spreadsheets in removing red tape and easy access to data. Yet, nearly three decades later, the large majority of people in the government have not taken to such innovative tools.
In ‘MISRA – and the era of cute acronyms’, Raghunanandan recounts his experience of reforming land records in Karnataka using MISRA, an interface he and his team created. At the time, reporting protocols of land administration had begun to fail. Less attention paid to the daily tasks of land record maintenance, coupled with staff shortages and the expansion of welfare responsibilities, was beginning to weaken the land records system. The resultant confusion and uncertainties about land ownership had the potential to derail the entire economic base for the rural economy. As a solution, Raghunandan and team established a computer-aided system that would completely replace the manual system that was in place.
In another experience, he discusses his stint with the tobacco board and how the computer operator was key to the integrity of the system which set quotas and imposed upper limits on what a farmer could sell. It took very little time for computer operators to hack the software. Then, for a price, farmers who exceeded quotas would be able to sell their extra tobacco.
Thus, while establishing good e-Governance infrastructure is essential, the human capital that goes in maintenance and implementation cannot be overlooked. AsRaghunanandan points out in his next blog ‘’Grasp’ing the Zilla Parishad’, the champions of e-Governance move on even before the systems they develop are entrenched in government processes.
He closes the series with a thought provoking look on thedichotomy in the government’s enthusiasm for e-Governance in ‘Attitudes that block e-governance’. He asks if the government is a lot more cautious when it comes to transparent service delivery while this is not the case when making transactions from the citizens to government (such as tax paying) easier.
This first piece introduces a series on Subaltern Urbanisation in India that aims at understanding the dynamics of small towns, their place and role in the Indian urban transition process. It summarises the origins, the rationale and the methodology of a collective research project that involved a team of around 25 researchers, including the urbanisation team at CPR. The series will detail some of the results produced in a recently published edited volume, point towards future directions for research, and open up debates on public policy.
The background of this project is located both in empirical and theoretical concerns. One out of 10 urban dwellers in the world lives in India and small towns (less than 100,000 population) account for 90% of Indian cities and over 40% of the urban Indian population. Therefore understanding India is necessary to understanding global urbanisation, and understanding Indian urbanisation requires an all-round view beyond the overwhelming attention given to metropolitan and large cities. There is therefore a need to return to a more complete idea of the urban and this includes the study of the dynamics of small towns.
Defining subaltern urbanisation
Coining the term Subaltern Urbanisation can be seen as polemical but it seeks to embody two important strands that shape a common thinking around the potential role of small towns.
First, it attempts to make small places intelligible in contrast to their current level of invisibility in India and at the international level;
Second, it tries to think of small towns as sites endowed with some level of autonomy and agency while the dominant paradigm, in particular in the New Economic Geography school of thought, sees small urban spaces as dependent on large metropolitan economies.
Methodology
From a methodological point of view, the project was launched by a collective formed around 2009 assembling researchers from different disciplines, in order to engage in a multidisciplinary dialogue combining both GIS (Geographic Information Systems), quantitative data and qualitative methodologies. Nevertheless, this mixed method approach has not only been used to capture diversity and multiscale analysis but also in order to understand small towns as abstracts entities. It goes deep into capturing the varied types of interactions that produce the diversity of these urban environments.
Redefining urban, its scope, and the urban transition process
The point of departure of this research and its content was to interrogate anew the definition of the urban, the scope of the urban world and the urban transition process itself.
Our research questions were shaped both from theoretical debates and from a prior research project that aimed to refine the UN’s (United Nations) efforts to build comparative data sets to measure urbanisation worldwide. It is grounded in a questioning of the existing restricted representations, measures and explanatory models of urban expansion.
For India, this data base enabled us to build data at the lower urban settlement level. It demonstrated the importance of small settlements, which was confirmed by the 2011 census. It aimed at bringing to the fore issues involved in defining the frontier of the urban and its political dimensions as well as raising the important (and to some extent increasing) role small towns play in the urban transition process. From a more theoretical point of view, our aim was to add to a growing body of work that reclaims the diversity of the urban phenomenon beyond the global metropolitan cities and highlights the range of national and regional trajectories.
Small towns and economic growth
An important aspect of the research was also concerned with the relationship between small towns, the larger employment story and growth. Indeed, small towns have remained an important feature of the Indian urban system. They might or might not account for a large share of the GDP but they represent a large and growing market and they also act as important service centres to the rural population. In a context of limited rural to urban migration, job destruction in the agricultural sector and very limited job creation, our results show how small towns are, inter alia, places of adjustment where people cope with poverty, uncertainty through the mobilisation of their kinship networks and family resources. This result, in particular, is confirmed by additional work carried out in Bihar and funded by the World Bank, which will be elaborated upon in a forthcoming podcast.
We have also been interested in the nature of economic activities that range from traditional activities (such as the collection of Tendu leaves in Abu Road in Rajasthan), to natural resource extraction (such as coal mining in Barjora, in West Bengal), manufacturing, services and trade; as well as real estate and the private and education institutions (in Tamil Nadu and Haryana in particular). Ethnographies of a variety of sites located in different States confirm the role of favourable land prices and regulation and cheap labour for the development of small towns. However, they also document how innovations and entrepreneurship are based on an ability to tap local resources and adapt to a very rapidly changing market condition, that include exploring international markets (such as the furniture industry in Kartarpur or drilling rig assembly industry in Tiruchengode).
The social dimensions of small towns’ economies
To answer this question, the project has also been concerned with understanding the kind of capital (human, land, social networks, etc.) that actors mobilise. It has observed small towns as sites of social changes and not looked at these spaces as frozen in time or as places of entrenchment of parochial societies. On the contrary, many case studies underscore the dynamism and the innovation taking place in some of these small towns, an innovation based on the harnessing of transnational networks (as in the case of the fishing industry in Udipi, in Karnataka), or the embeddedness of symbolic and religious dimensions in handling land and financial capital (as seen in the temple towns of Tamil Nadu). These interrelated dimensions are inscribed in a field of social relations, or historically trade relations. In other words, by paying attention to the multiplicity of interactions and the multiscale shape of networks, this project attempts to reclaim an embedded view of economic and social changes.
Small towns, governance and the politics of classification
Another research theme has dealt with the questions of governance and the politics of urban classification, as to whether it is important or not to have an urban status. This question is particularly acute for Census Towns that are classified as urban by the Census of India but remain rural settlements in terms of governance. Beyond analysing the linked benefits and costs of an urban status, the focus on the governance issue is critical to engage with public policies regarding cities and urban development.
The questions that the Subaltern Urbanisation book has raised and some of the answers it has provided is not only relevant for India but for other global contexts as well. By giving flesh and emphasising the diversity of urban processes, it can open up or contribute to a dialogue with other countries and continents for instance China, Asia and Latin America where the process of in-situ urbanisation is discussed, or even with Europe where interest in the place and the role of small towns has been renewed.
The next piece will discuss the nature and the extent of urbanisation in India and its evolution based on Census data analysis.
Watch the full video (above) of the recent CORP seminar discussing the private septic tank emptying sector in India through case studies, in-depth ethnographic work and projections of business models.
Tarun Sharma discusses the market for private septic tank emptying services in the three cities of Dehradun, Jaipur and Bhubaneshwar, while Marie-Helene Zerah and Sweta Xess discuss the findings of a deep-dive ethnographic study of these operators in the peri-urban settlement of Aya Nagar (near the Delhi-Gurgaon boder). Finally, Anindita Mukherjee and Prashant Arya present the results of a projection exercise showing the progressive impact that regularisation and formalisation would have on the operations of these enterprises.
The presentation and the subsequent discussion dwelt on the need, and potential consequences of, regularising an informal sector with broad public health implications, the role of manual scavenging in such enterprises and the hidden costs of labor, and the need to understand the fundamental role that caste and community identities play in this particular kind of work.
Marie – Hélène Zérah is a Research Fellow at CESSMA (Centre d’études en sciences sociales sur les mondes africains, américains et asiatiques) / IRD (Institute of Research for Sustainable Development) deputed to the Centre for Policy Research.
Sweta Celine Xess is a Research Associate with the Centre for Policy Research.
Tarun Sharma is Director and Co-founder of Nagrika, a social enterprise focused on the issues of small and mid-sized cities.
Anindita Mukherjee is a Senior Researcher at the Centre for Policy Research working in the project, Scaling City Institutions for India (SCI-FI): Sanitation.
Prashant Arya is a Research Assistant with the Centre for Policy Research.
The question and answer session that followed the seminar can be accessed here.
Land transformation has been at the centre of economic growth of post-colonial, Asian nation-states. While their political reforms and economic policies have focused on land governance, the outcomes have resulted in promoting privatisation and speculative business interest in ecologically sensitive landscapes that are also under diverse forms of common use by resource-dependent communities. A three-year study undertaken to understand community-level responses to land use transformation in India, Indonesia and Myanmar shows that the current scale and approach of land–intensive development in these large democracies is facilitated by fast-paced, top down policy changes. These policies are ‘stacked’ (when multiple layers of current and revoked laws are simultaneously in use) rather than integrated and their implementation is the responsibility of various authorities and agencies that overlap.
Growing private investments in land that has remained within varying degrees of state control have changed the way land is managed. Land has become increasingly securitised and ‘out of bounds’ for small farmers and other land-users with or without recognised forms of ownership and use rights. Land conflicts are caused due to coercive acquisition processes or land grabs, unlawful operations of projects and long pending remedies to social and environmental impacts. In many instances, these conflicts begin even before the final decisions on projects are taken and persist for years.
Highly capitalised land use change brings powerful investors and corporations, governments and local communities in unequal and precarious arrangements of negotiation and confrontation. Citizens and communities affected by land use change, use varied strategies such as administrative complaints, protests, litigation, media campaigns and political advocacy, and engage in improving project design and implementation, increase compensations, restore community access to resources and get a review on the operations of harmful projects. These are done under conditions of political intransigence and criminalisation of those who speak up. While all three countries have recognised land conflicts and their impact on development plans and proposals, they are yet to give affected people a formal and effective role in land and natural resource governance.
The study reports on India, Indonesia and Myanmar and an overview of the study’s methodology and findings can be accessed here.
A series of blog posts over the next two months will highlight specific research findings and case studies.
This study was carried out by the CPR-Namati Environmental Justice Program, supported by a grant from the International Development Research Centre, Ottawa, Canada.
AS PART OF ‘POLICY CHALLENGES – 2019-2024: THE BIG POLICY QUESTIONS FOR THE NEW GOVERNMENT AND POSSIBLE PATHWAYS’
CPR LAND ACQUISITION
By Namita Wahi
An estimated 7.7 million people in India are affected by conflict over 2.5 million hectares of land, threatening investments worth $ 200 billion.1 Land disputes clog all levels of courts in India, and account for the largest set of cases in terms of both absolute numbers and judicial pendency. About 25% of all cases decided by the Supreme Court involve land disputes, of which 30% concern disputes relating to land acquisition.2 Again, 66% of all civil cases in India are related to land/property disputes.3 The average pendency of a land acquisition dispute, from creation of the dispute to resolution by the Supreme Court, is 20 years. Since land is central to India’s developmental trajectory, finding a solution to land conflict is one of the foremost policy challenges for India.
Understanding Incidence and Pendency of Land Conflict in India
Legislative and administrative factors are responsible for the high incidence of legal and extralegal conflicts over land, and judicial factors are behind the pendency of land disputes. Competing historical and current policy narratives of property rights over land, have resulted in the coexistence of numerous, conflicting laws leading to legal disputes over land. This is the legislative factor. This problem is compounded by administrative failure to comply with the rule of law. This is the administrative factor. The pendency of conflict, in turn, is a result of legal and evidentiary barriers in bringing land disputes to court, largely due to administrative and judicial incapacity; this prevents expeditious resolution of land disputes. This is the judicial factor.
Conflicting narratives, policies and land laws create land disputes
There are two conflicting narratives about ownership and management of land in India. The first narrative – inherited from the British colonial state5 – views common land, or land that is not privately owned, as merely a commodity, no different from labour and capital, with the state as the ultimate owner.6 This claim to ultimate ownership gives the state the power to redistribute land at will, as largesse to selected beneficiaries.7 Such state acquisition of land has historically been the source of considerable dispute. According to estimates by CPR’s Land Rights Initiative (LRI), these disputes constitute 30% of all land litigation in the Supreme Court over the past 70 years. LRI’s comprehensive study of land acquisition litigation before the Supreme Court over a 66-year period, from 1950 to 2016, reveals that all litigation is with respect to privately held land. In contrast, data from the Land Conflict Watch project reveals that the vast majority of current, on-ground, extralegal conflict over land is with respect to common lands.8 Thus, it is clear that in the face of state acquisition of land, when people have legally recognized land rights, they go to court. Where their rights are insufficiently recognized by law, they protest on the ground.
The second narrative – articulated by the ‘people’, including farmers, both landowners and tenants; and other traditional communities, such as cattle grazers, forest dwellers, tribals and fisherfolk – views land as an economic, social and cultural resource over which multiple groups exercise property rights. Usually, after intense on-ground contestation, the property rights of certain groups like Scheduled Tribes (STs)and tenants have been protected by the Constitution9 and statute,10 while in case of other groups like fisherfolk,11 their rights are protected by custom and, often, executive action.
As a consequence of these two historically competing policy narratives, the constitutional, legislative and administrative framework governing land is as fragmented as the land holdings in India.12 Enacted at different points of time, land laws clash with each other, because they seek to articulate in law these two competing narratives. For instance, the provisions of the Forest Rights Act, 2006, are in conflict with those of the Indian Forest Act, 1927, and the Forest Conservation Act, 1980, and are also threatened by proposed amendments to the Indian Forest Act.13 Legal conflicts also arise when laws are enacted or amended at different times to appease different stakeholders. For instance, the Right to Fair Compensation and Transparency in Land Acquisition, Rehabilitation and Resettlement (RFCTLARR) Act has, in the five years since it came into force, been amended by seven state legislatures.14 This will likely create more legal disputes with respect to land acquisition, because the original RFCTLARR Act provisions had been included with a view to addressing growing conflict over land acquisition.15 Moreover, in many states, we find laws that provide for eviction of unauthorized occupants over public lands coexisting with laws that provide for regularization of unauthorized occupation, thereby creating potential for dispute/conflict at the level of law itself.16
Finally, the legislative landscape is complicated by the fact that many subjects pertaining to ‘land’ are in the ‘state’ and ‘concurrent’ lists of the Constitution, leading to a multiplicity of original and active land laws.17 Yet, there is no official comprehensive database of all land laws in India. A first of its kind, ongoing LRI study estimates that India has over a thousand original and active central and state land laws.18
The problem of ‘multiple laws’ is exacerbated by the fact that these laws are administered by numerous government ministries at the central level, and departments at the state level. These include, for instance, the ministries of Law and Justice, Rural Development, Mining, Industries, Infrastructure, Urban Development, Tribal Affairs, Home Affairs and Defence.
Administrative non-compliance with law also creates and prolongs land disputes
Where laws are clear, disputes and conflicts arise because of administrative non-compliance with the rule of law due to both unwillingness and incapacity. The LRI study of all Supreme Court cases on land acquisition during 1950-2016 shows that 95% of the disputes arose because of administrative non-compliance with the legal procedure for acquisition of land, including the process of computation of market value compensation for land acquired.19 Around 34% of the disputes involved irregularities in completion of the procedure for acquisition. Almost half of such cases concerned with procedural irregularities involved administrative unwillingness to comply with the rule of law. The remaining half of the cases involved administrative incapacity to comply with the rule of law, in part because of governmental failure to regularly update administrative manuals based on changes in the law. Moreover, the government was more likely to lose than win these land disputes before the Supreme Court.20
Additionally, since colonial times, land in India has been broadly administered by the revenue and forest departments. But there have also always existed disputes between both departments as to which land belongs to which department. This in turn creates and prolongs land disputes.
Finally, legal disputes over land are also created by evidentiary barriers for establishing rights over land in the absence of documentary proof21 because of outdated/no land surveys22 and inaccurate/outdated land records23 in most states. The Department of Land Resources has sought to resolve the problem of inaccurate land records through the ‘Digitisation of Land Records Modernisation Programme’. However, unless the government makes a serious attempt to update land records on the ground to reflect the property rights of all landowners, digitizing them would not eliminate the problem of inaccurate land records.
Judicial reasons cause pendency of land disputes
Once a land dispute goes to court, serious judicial incapacity leads to pendency of disputes. First, a major cause for pendency of all disputes is India’s low judge-to-people ratio.24 Land cases form more than half of all civil cases and constitute over a quarter of cases before the Supreme Court; they also have the longest pendency compared to other cases. Hence low judge-to-people ratio particularly prolongs resolution of land disputes. Second, the judiciary, particularly at its lowest levels, lacks the financial, technical and infrastuctural capacity necessary to resolve disputes quickly.25 Finally, poor enforcement of court decisions by the government, and limited judicial capacity to follow up on such enforcement, especially when such decisions go against the government, also lead to prolonging of land disputes.
Policy Recommendations for Reducing Incidence and Pendency of Land Disputes
Eliminate legal conflicts. No government has ever attempted an exercise to rationalize existing land laws. But this is the need of the hour. The Law Ministry and Law Commission are best positioned to conduct or commission such an exercise. This would involve, first, the creation of an exhaustive database of all land laws in India. Once such a database of laws is created, the Law Ministry and Law Commission must identify, and Parliament must repeal, laws that deny rights of certain groups of people, particularly women,26 and eliminate genuine conflicts between laws.
Improve administrative willingness and capacity to implement the rule of law: The government must take steps to ensure greater administrative capacity and willingness to implement the rule of law. In addition, we need greater coordination between government departments dealing with land, transparency of land administration, and better access to land data. This can be achieved by undertaking the following measures.
The Department of Land Resources, currently under the Ministry of Rural Development, is the nodal agency for coordination of land policy across states. But land is not merely a rural concern. As India becomes increasingly urbanized, the government needs to have a more comprehensive imagination of land requirements for rural and urban populations. The creation of a separate Ministry of Land to serve as the nodal agency for coordinating land policy across different types of land is critical.
There needs to be a coordinated effort between the Ministry of Law and Justice, Department of Land Records, Ministry of Environment and Forest, Ministry of Tribal Affairs, state boards of revenue, and state forest departments to resolve conflicting land laws and streamline land administration.
All government departments dealing with land, and particularly those involved in land acquisition, must update administrative manuals in accordance with changes in legislation and judicial precedent.
Through dedicated interdepartmental meetings and other coordination, government must resolve land boundary disputes between the revenue and forest departments.
The government must devote financial and technical resources to conduct land surveys and update paper records to reflect property rights of all the people, as opposed to digitization of existing records that are substantially inaccurate.
The government must ensure better skills training so that officials dealing with land have both the knowledge and the capacity to implement the rule of law. Institutional mechanisms should be designed to incentivize compliance with, not defiance of, the rule of law.
Given the low success rate of government appeals, the government must carefully evaluate the likelihood of success of an appeal before pursuing it. Government officials must be incentivized to not appeal cases that have little likelihood of success following such an evaluation. This would go a long way in reducing pendency of land disputes.
The government must wholly commit to transparent land administration and comply with its obligations under the Right to Information Act, 2005, to make digitally accessible all land laws, executive notifications, rules, circulars, etc. pertaining to land administration. In addition, the government must open up to public scrutiny departmental data on compliance with land laws.
In addition to legislative and administrative reforms, judicial reforms can go a long way towards reducing the pendency of land litigation in India. The first step in this direction would be the implementation of key recommendations of the Law Commission.27 These include:
Changing the base for determining sanctioned posts for judges from ‘Judge: Population Ratio’ to ‘Rate of Disposal Method
Filling up all existing vacancies
Increasing the retirement age of subordinate judges to 62; and those of High Court and Supreme Court judges to 65 and 68 years respectively.
Greater financial allocations to the lower and higher judiciary, to enable infrastructure, technical and skills upgradation
Some states like Bihar have created separate land tribunals for expeditious resolution of land revenue cases. This model should be studied, and if found effective, should be replicated in other states.
Conclusion
Land conflict in India, both legal and extralegal, has existed from colonial times because of the imposition by the British state of the notion that all land not privately held belongs to the ‘state’. This concept has been continuously resisted by the ‘people’ who were disempowered by the colonial state’s deprivation of their legal property rights under precolonial administration. Over time, competing ‘state’ and ‘people’ narratives over land have led to conflicting policy and legal interventions. This has, in turn, led to legal disputes over land. Even when laws are clear, administrative failure to comply with the rule of law, due to unwillingness and incapacity, contributes to the incidence and pendency of land disputes. Serious judicial incapacity in turn prolongs pendency of land disputes.
Due to the increasing population pressure on land, and the corresponding demand for land to fuel the development engine, the scale and scope of land conflict today has assumed gigantic proportions, stalling development projects and threatening livelihoods and investments. Equitable and efficient intergenerational management of land is necessary not just for India’s economic development, but also for its political and social stability. Therefore, working towards resolving land conflict, in light of the above policy recommendations, is an imperative agenda for the new government.
Other pieces as part of CPR’s policy document, ‘Policy Challenges – 2019-2024’ can be accessed below:
The Future is Federal: Why Indian Foreign Policy Needs to Leverage its Border States by Nimmi Kurian
Rethinking India’s Approach to International and Domestic Climate Policy by Navroz K Dubash and Lavanya Rajamani
India’s Foreign Policy in an Uncertain World by Shyam Saran
Need for a Comprehensive National Security Strategy by Shyam Saran
A Clarion Call for Just Jobs: Addressing the Nation’s Employment Crisis by Sabina Dewan
Time for Disruptive Foreign and National Security Policies by Bharat Karnad
Multiply Urban ‘Growth Engines’, Encourage Migration to Reboot Economy by Mukta Naik
Schooling is not Learning by Yamini Aiyar
Clearing Our Air of Pollution: A Road Map for the Next Five Years by Santosh Harish, Shibani Ghosh and Navroz K Dubash
Protecting Water while Providing Water to All: Need for Enabling Legislations by Philippe Cullet
Interstate River Water Governance: Shift focus from conflict resolution to enabling cooperation by Srinivas Chokkakula
Managing India-China Relations in a Changing Neighbourhood by Zorawar Daulet Singh
Beyond Poles and Wires: How to Keep the Electrons Flowing? by Ashwini K Swain and Navroz K Dubash
Regulatory Reforms to Address Environmental Non-Compliance by Manju Menon and Kanchi Kohli
The Numbers Game: Suggestions for Improving School Education Data by Kiran Bhatty
Safe and Dignified Sanitation Work: India’s Foremost Sanitation Challenge by Arkaja Singh and Shubhagato Dasgupta
Safeguarding the Fragile Ecology of the Himalayas by Shyam Saran
Female Labour Force Participation: Asking Better Questions by Neelanjan Sircar
Towards ‘Cooperative’ Social Policy Financing in India by Avani Kapur
1 Land Conflict Watch, https://www.landconflictwatch.org/.
2 This is based on preliminary findings from a CPR Land Rights Initiative study, and is also consistent with findings from a comprehensive quantitative study of the Supreme Court’s caseload between 1993 and 2011. See Nick Robinson, ‘A Quantitative Analysis of the Indian Supreme Court’s Workload’, Journal of Empirical Legal Studies,10(3) (2003): 570-601.
3 Daksh, ‘Access to Justice Survey, 2016’, http://dakshindia.org/wp-content/uploads/2016/05/Daksh-access-to-justice….
4 Namita Wahi et al., ‘Land Acquisition in India: A Review of Supreme Court Cases from 1950 to 2016’ (New Delhi: CPR, 2017).
5 Articles 294 and 295 of the Indian Constitution stipulate that the Indian state succeeds to all property, claims and assets of the British state.
6 B.H. Baden Powell, The Land Systems of British India (Oxford University Press: 1892); B.H. Baden Powell, A Manual of Jurisprudence for Forest Officers Being a Treatise on Forest Laws (Calcutta, 1882).
7 An LRI study estimates that there are 102 laws of land acquisition alone, including state amendments to the Land Acquisition Act, 1894. Supra note 4.
8 ‘Land Conflicts in India: An Interim Analysis’, https://rightsandresources.org/en/publication/land-conflicts-india-inter….
9 Article 244(1) and Article 244(2), read with the Fifth and Sixth Schedules respectively, create special protections for land rights of Scheduled Tribes in geographically demarcated areas, known as Scheduled Areas.
10 Starting with the Bengal Tenancy Act, 1885, almost each agrarian state has laws protecting tenancy rights. Similarly, the Forest Rights Act, 2006, recognizes land rights of Scheduled Tribes and other forest dwelling communities.
11 A prolonged movement has sought the enactment of a Fishing Rights Act, along the lines of the Forest Rights Act.
12 86.21% of all land holdings in India are small and marginal holdings taken together (0.00-2.00 ha). See Census of India.
13 Nitin Sethi et al., ‘Modi government plans more draconian version of colonial-era Indian Forest Act’, The Wire, 21 March 2019, https://thewire.in/rights/modi-government-plans-more-draconian-version-o…
14 These include the states of Tamil Nadu, Gujarat, Rajasthan, Maharashtra, Telangana, Andhra Pradesh and Jharkhand. See Namita Wahi, ‘How central and state governments diluted the historic land legislation of 2013’, The Economic Times https://economictimes.indiatimes.com/news/politics-and-nation/how-centra….
15 Jairam Ramesh et al., Legislating for Justice: The Making of the 2013 Land Acquisition Law (New Delhi: Oxford University Press, 2015); Namita Wahi, ‘The Story of Jairam Rajya’ India Today, June 2015, https://www.indiatoday.in/magazine/books/story/20150622-jairam-ramesh-la….
16 Ongoing LRI study on ‘One Thousand Land Laws’.
17 Article 246 read with the Seventh Schedule of the Constitution of India.
18 CPR ‘Land Laws’ Database; see: https://www.cnbctv18.com/legal/hundreds-of-indian-land-laws-cause-confus….
19 Wahi et al., ‘Land Acquisition in India’.
20 Ibid. p. 28.
21 Sections 61-64 of the Indian Evidence Act, 1872, emphasize that documents must be proved by primary evidence, that is, presentation of the document itself. However, many people with legally recognized land rights do not have documentary proof for the same. This makes judicial resolution of land disputes extremely difficult.
22 Much of the northeastern part of India, including the state of Assam, has never been fully surveyed. The last full land survey for the state of Bihar happened in 1950s-1960s.
23 Former Minister for Rural Development notes that the state’s failure to fairly compensate those who lost land under the 1894 Act arose due to inaccurate land records, rampant undervaluation of sale deeds, and absence of land markets in many rural areas. See Ramesh et al., Legislating for Justice.
24 Two reports – the 245th Law Commission Report on ‘Arrears and Backlog: Creating Additional Judicial (Wo)man) power’ (2014), http://lawcommissionofindia.nic.in/reports/Report_No.245.pdf, and the 230th Law Commission Report on ‘Reforms in the Judiciary: Some Suggestions’, http://lawcommissionofindia.nic.in/reports/report230.pdf – highlight this as a major cause for disputes.
25 Ibid.
26 Bina Agarwal, ‘Gender and Legal Rights in Agricultural Land in India’, Economic and Political Weekly A39 30(12) (March 1995).
27 Supra note 24. (Q: Pl give direct source)
28 245th Law Commission Report, 29.
Watch the full video of the panel discussion on ‘Understanding India’s Energy Transition in Global Context’, organised as part of CPR Dialogues, featuring Michael Grubb, Navroz K Dubash, Radhika Khosla, Ashok Sreenivas, chaired by Ajay Mathur.
India faces three substantial challenges in the coming decades with enormous implications for its future energy demand. First, India has yet to provide clean cooking energy to 800 million people, and electricity access to 200 million people; failure to achieve this will dramatically reduce the human development possibilities for vast numbers of Indians. Second, India has to create jobs at pace with our shifting demography, which cannot happen without more and better power – electricity demand is likely to at least double in the next fifteen years at a time when clean energy is rising up the national and global political agenda. Third, the quality and form of India’s urban transition has enormous implications for energy needs. Managing these simultaneous pressures poses a severe challenge because India has to transform to the energy sector of the 21st century even as we grapple with 20th century problems of waste, theft and unreliability.
Moreover, India’s energy transition is taking place within a larger global energy context, which will shape available supply options. Globally, the steep fall in price of renewable energy technologies has sparked a conversation about how, not when, economies will transition to a predominantly renewable energy future. However, the transition costs and challenges are potentially substantial and hotly disputed. Moreover, global oil and gas economics and politics have been cast into uncertain territory with the development of shale oil and gas technologies. And not least, the imperative of addressing climate change in the face of ever more dire warnings by the Intergovernmental Panel on Climate Change hangs like a shadow over global energy futures, and in particular puts pressure on an expansion of coal-based energy.
Historically, India has viewed pressures to mitigate climate change, in particular, as a threat to development. And indeed, India’s energy needs remain substantial, and any pressures to absolutely limit energy use or increase the costs of energy will have negative social and economic effects. At the same time, India is grappling with many other challenges that could also be solved by judicious shifts toward energy efficiency and cleaner energy: energy security due to import dependence in oil could be mitigated by renewable powered electric cars; congested cities could be cleared by energy-saving public transport; and air pollution could be mitigated through energy efficiency and renewable energy. The question before India, therefore, is whether India can productively leverage global energy trends through a judicious mix of demand and supply approaches even while meeting its own energy needs? Or do these trends pose a challenge to India as the country expands energy use in service of development?
From one perspective, rapid global change provides an opportunity: India has yet to lock into technologies and institutional paths that were designed for coal, oil and centralized power, and can build an energy and electricity system better suited for the 21st century. From the other, negotiating a complex technology and institutional transition, while dealing with the overhang of 20th century energy problems of low access and weak and inefficient systems, seems only to be a challenge.
This panel explored to what extent India’s energy transition, in the context of a global energy transition, provides opportunities versus throws up challenges, and what India can do to effectively negotiate this transition.
Ajay Mathur is Director General, The Energy and Resources Institute (TERI).
Michael Grubb is Professor of Energy & Climate Change, Bartlett School Environment, Energy & Resources, Faculty of the Built Environment, University College London.
Navroz K Dubash is a Professor at CPR.
Radhika Khosla is Research Director, Oxford India Centre for Sustainable Development, University of Oxford and Visiting Fellow, CPR.
Ashok Sreenivas is Senior Fellow at Prayas (Energy Group).
The question and answer session that followed can be accessed here.
Key takeaways about the Dialogues by Michael Grubb can be accessed here.
CPR-LAND RIGHTS INITIATIVE REVIEWS SUPREME COURT CASES ON LAND ACQUISITION FROM 1950 TO 2016
RIGHTS LAND ACQUISITION
Context:
India faces serious challenges in creating development processes that generate economic growth while being socially inclusive, ecologically sustainable, politically feasible, and in accordance with the Rule of Law. Equitable and efficient acquisition of land by the state for economic development projects, including infrastructure and industry, lies at the heart of these challenges.
Simultaneously, securing constitutionally guaranteed land rights to the poorest and most vulnerable communities in India against the state and other dominant communities, has been considered crucial to their economic and social empowerment. Land is not only an important economic resource and source of livelihoods, it is also central to community identity, history and culture. Unsurprisingly then, throughout India, dispute over state acquisition of land that deprives people of their land rights spans various dimensions of economic, social, and political life.
How do we mitigate this conflict?
The CPR Land Rights Initiative report on ‘Land Acquisition in India: A Review of Supreme Court cases from 1950-2016’, offers some preliminary answers to this question. Not only is this report the first comprehensive country-wide study of land acquisition disputes since India’s independence, but also for the first time ever analyses these disputes along various metrics, such as i) public purpose, ii) procedure for acquisition, iii) compensation, iv) invocation of the urgency clause, v) pendency of claims, and vi) tracks trends with respect to distribution of disputes across geography and time, and central and state laws. The Report also analyses litigation under the newly enacted Right to Fair Compensation and Transparency in Land Acquisition, Rehabilitation and Resettlement Act, 2013 (LARR Act) for the three year period, 2014 to 2016.
Key findings:
Reasons for inequity between state and land losers: The Report concludes that the political and social contestation over land acquisition stems from the inherently coercive nature of the land acquisition process, which creates a severe imbalance of power between the state and land losers. While much of this imbalance was created by the text of the Land Acquisition Act, 1894, a considerable part of it could also be attributed to executive non-compliance with the rule of law. The result is a situation of great inequity for the land losers.
Legal reform under the LARR Act should be implemented by government, not subverted to redress these inequities: The Report finds that specific provisions of the LARR Act are steps in the right direction to redress the imbalance of power that was built into the Land Acquisition Act, 1894 in so far as: i) they empower livelihood losers along with title-holders to bring claims for compensation and rehabilitation, ii) bring compensation requirements in accordance with existing reality, and iii) introduce requirements of consent and social impact assessment. The Report shows that litigation helps channelise political contestation of state action into legal as opposed to extra legal disputes. Therefore, by empowering hitherto disempowered land losers to bring claims under the LARR Act, the Act will help preempt extra-legal conflict. Since conflict inevitably stalls or derails legitimate development projects, it is in the interest of the government to comply with, and not subvert the LARR Act.
Legal reforms must be supplemented by administrative and bureaucratic reforms: The Report highlights that legal reform is a necessary but not a sufficient precondition for ensuring greater equity and efficiency within the land acquisition process. In the absence of administrative and bureaucratic reforms, the introduction of the LARR Act will not succeed in eliminating inequities and inefficiencies embedded within the implementation of existing land acquisition procedures. In fact, the increase in procedural requirements under the LARR Act implies an even greater need for securing executive compliance with the rule of law, in order to translate the equities intended by these additional procedures into reality for land losers.
Types of administrative reforms required: Such administrative reforms include building of state capacity to meaningfully comply with the increased procedural requirements stipulated by the LARR Act, and designing institutional structures that incentivise such compliance with the rule of law. This, in turn, requires a serious mind-set shift within the government toward accepting the reform enshrined in the LARR Act, and not subverting it as we have seen in both the LARR Ordinance, and the state amendments to the LARR Act, as also the rules adopted to implement the LARR Act in the states.
Watch (above) a detailed presentation of the findings from the report.