Since the start of this calendar year, annual consumer price index (CPI) inflation has ruled not only above the Reserve Bank of India’s (RBI) target of 4%, but even its upper tolerance level of 6%, for every month from January to May. If we take the 38 months from April 2019 to May 2022 – roughly coinciding with the Narendra Modi-led government’s second term (Modi 2.0) – CPI inflation has exceeded the 4% target in as many as 32 months and even the 6% ceiling in 18 months. This has been seen by many as a failure on the part of the central bank to adhere to its inflation-targeting mandate, enshrined in law since June 2016 (https://bit.ly/3b1JJbZ and https://bit.ly/3OcrDCp).
The above “failure” is in contrast to the “success” achieved in the Modi government’s first term (Modi 1.0). During that period, roughly from April 2014 to March 2019, the 6% ceiling was breached only in 6 out of the 60 months. Moreover, CPI inflation was contained within 4% in 23 out of the 60 months. A far cry from the 6 out of 38 in Modi 2.0, with even those six being in the first six months from April to September 2019!
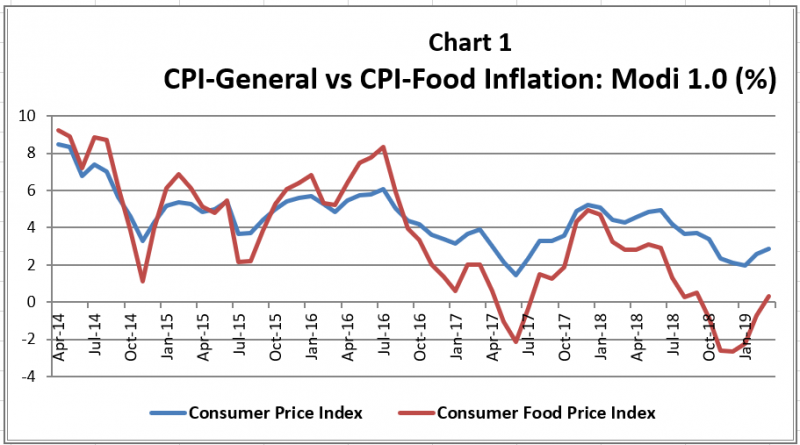
But the story isn’t just about overall retail inflation. During Modi 1.0, year-on-year general CPI inflation averaged 4.49%. It was even lower, at 3.52 per cent, for the consumer food price index (CFPI) inflation, with the latter ruling below the former in as many as 38 out of the 60 months. In other words, while inflation in general was benign, food inflation was even more so. That trend was visible particularly after September 2016, as can be seen from Chart 1.
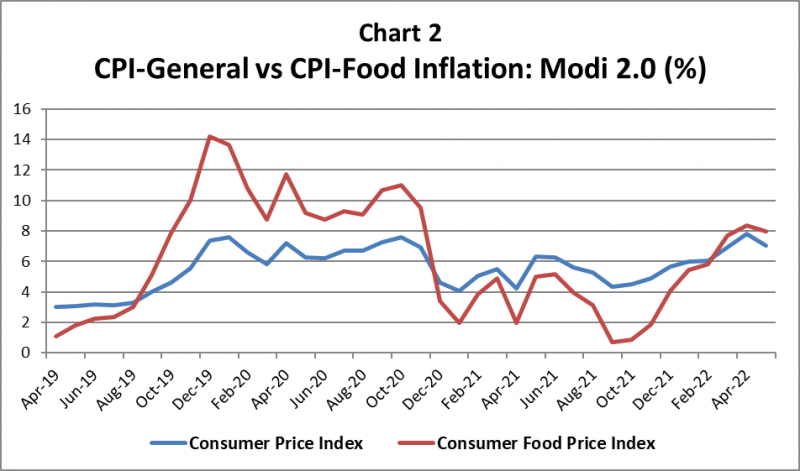
It’s been quite the opposite in Modi 2.0. Overall CPI inflation has averaged 5.59% during these 38 months, 1.1 percentage points higher than in Modi 1.0. No less striking is CFPI inflation, which has averaged even higher, at 6.21% or almost 2.7 percentage points more than during Modi 1.0. In 18 out of the 38 months, food inflation has exceeded general CPI inflation, while also exhibiting greater volatility, as Chart 2 shows. For both the government and RBI, food inflation has been the bugbear – due to greater political sensitivity and less amenability to control through monetary policy tools such as repo interest rate and cash reserve ratio hikes.
Imported inflation
A major source of the resurgent food inflation has been global prices.
During the Modi 1.0 period, these were low: International agri-commodity prices actually collapsed from around late-2014. The UN Food and Agriculture Organization’s food price index (FPI; base year: 2014-2016=100) averaged 131.9 points in 2011, which was at the height of the previous commodity boom/super cycle. The index fell to 122.8 in 2012, 120.1 in 2013 and 115 in 2014, before plummeting to an average of 93 and 91.9 points in the subsequent two years. The average annual FPI inflation during April 2014 to March 2019 was minus 3.95%, below even the corresponding Indian CFPI rate of 3.52%.
Again, it’s been the other way round in Modi 2.0, where global FPI inflation has averaged 13.42%, higher than the 6.21% retail food inflation in India over the 38 months from April 2019 to May 2022. Simply put, while low international agri-commodity prices helped control domestic food inflation during Modi 1.0 – even translating into depressed crop realizations for farmers – their soaring from around October 2020 has produced the opposite effect. The FPI crashed to a four-year-low of 91.1 points in May 2020 when most countries had severe lockdown restrictions in place. But with the post-Covid demand recovery and easing of lockdowns, the index rose to 135.6 points by January 2022. The Russian invasion of Ukraine on February 24 took it to an all-time-high of 159.7 points in March, from where it has marginally fallen to 157.4 in May.
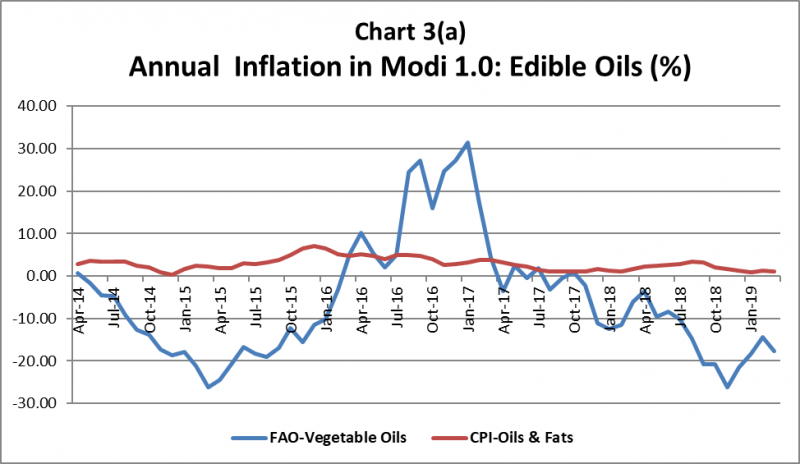
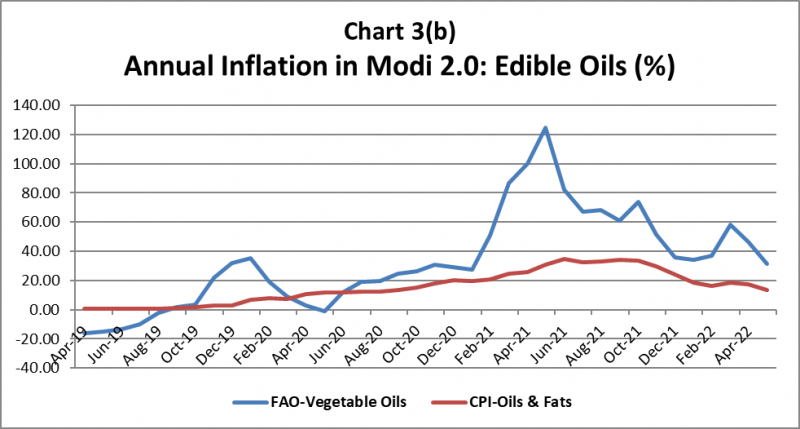
The transmission of international prices to domestic inflation in India is best illustrated by edible oils. During the Modi 1.0 period, average year-on-year inflation in the global FPI for ‘vegetable oils’ was minus 5.79%, while at 2.89% for the CPI in ‘oils and fats’. But in Modi 2.0, the former has averaged 33.31% and the latter 15.5%. Charts 3(a) and 3(b) plot the month-wise FPI and CPI inflation rates in edible oils for both periods. The correlation coefficient for international and domestic inflation is positive for edible oils: 0.33 in Modi 1.0 and 0.85 in Modi 2.0. Indian consumers benefitted from very low (almost flat) inflation during 2014 to much of 2020, whether in palm, soybean, sunflower, mustard and groundnut oil or vanaspati (hydrogenated vegetable oil). But as global prices of vegetable fats skyrocketed – for reasons we shall detail in the next section – consumers experienced sudden and sharp inflation in this commodity (https://bit.ly/3tBalqX).
There’s no such correlation, though, when it comes to cereals. Average annual inflation was low both for CPI in ‘cereals and products’ and FPI in ‘cereals’ – at 3.38% and minus 3.32%, respectively – during the Modi 1.0 period. In Modi 2.0, India’s CPI cereal inflation averaged even lower, at 2.6%. This was despite the average year-on-year global cereal FPI inflation shooting up to 12.81% during this 38-month period. Unlike with edible oils, the correlation coefficient for international and domestic inflation has been weak and negative in cereals – at minus 0.017 during Modi 1.0 and minus 0.40 during Modi 2.0. The reason for it has to do with government’s minimum support price (MSP)-based procurement and stocking of wheat and rice for channeling through the public distribution system (PDS). Maintaining more than adequate stocks in the Central pool, both for the PDS and open market operations, has effectively insulated Indian cereal prices from the vicissitudes of the world market. The PDS prevented inflation from being imported into India during Modi 2.0, just as MSP procurement ensured no cereal deflation during Modi 1.0.
We have found similar results for sugar and dairy. As the table below shows, average CPI inflation has fallen for both during Modi 2.0 compared to that in Modi 1.0, even while rising significantly for the global sugar and dairy FPIs.
Sugar and Milk inflation: Domestic vs Global
(% average year-on-year)
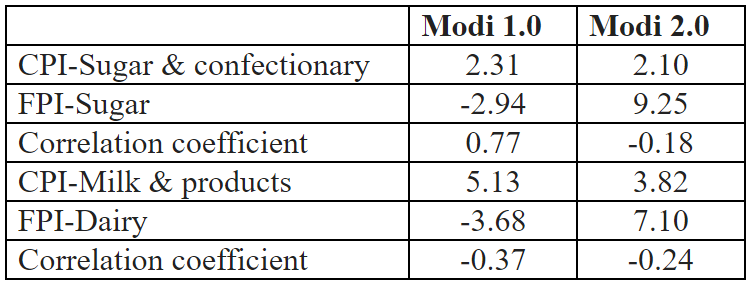
Low international sugar prices weighed heavily on realizations for domestic mills and, in turn, their ability to pay cane growers during a greater part of the Modi 1.0 period. But in Modi 2.0, high global prices helped Indian mills to export record quantities. At the same time, production being in excess of
domestic consumption requirements – which was the case for rice and wheat as well – ensured little CPI inflation in sugar. Production self-sufficiency, coupled with established systems of procurement and marketing by cooperatives and organized private dairies, has resulted in no imported inflation for milk and milk products either. The correlation coefficient between international and domestic prices has been negative and weak for sugar, dairy and cereals, while positive and strong in edible oils during Modi 2.0. Inflation from import dependence and the resultant transmission of international prices has been a factor for pulses too. Average CPI inflation in pulses was only 4.29% in Modi 1.0. It has more than doubled to 10.31% during Modi 2.0. Pulses imports peaked during 2015-16 to 2017-18, averaging over 6 million tonnes (mt). In the last three years, imports have more than halved to about 2.7 mt, but they are still significant relative to domestic production of 24-25 mt.
Structural versus idiosyncratic inflation
Food inflation isn’t new to India. Average annual inflation in the wholesale price index for ‘food articles’ was 10.21% during the previous UPA regime from 2005-06 to 2013-14. That inflation, though, was structural and demand-led, driven by growth in incomes, including of poor and lower-middle class households. Rising real incomes, as a previous note in this series has shown (https://bit.ly/3nheUTP), also contributed to significant dietary diversification, with per capita consumption of foods rich in proteins, vitamins and minerals (milk, egg, meat, fruits and vegetables) going up and that of carbohydrates/calories-based foods (cereals and sugar) declining. A byproduct of it was what the former RBI deputy governor Subir Gokarn termed “protein inflation”. In a late-2010 paper (https://bit.ly/3N4vEb0), he wrote how “increasing demand for proteins appears to be an inevitable consequence of rising affluence”, while warning of persistent demand-supply balances that would make pulses, milk, eggs, fish and meat relatively costlier down the line.
The current food inflation, on the other hand, is more idiosyncratic and supply shock-driven, rather than structural. We have already noted that retail inflation in milk and milk products has fallen during the Modi 2.0 period. Annual growth in milk sales by cooperatives, too, has averaged just over 3 per cent from 2014-15 to 2020-21 (National Dairy Development Board annual reports). Low price increase and sales growth in milk – a product with very high income elasticity of demand in India (https://bit.ly/3HyTlHA) – is indicative of no major “structural” drivers and the return of food inflation being attributable mainly to “supply-side” factors.
The last two years and more have witnessed four kinds of supply shocks – from weather, export controls, pandemic and war.
Ukraine, even before the war, had drought in 2020-21 (https://bit.ly/3bfzYaw) that reduced its exports of sunflower oil, corn and wheat to 5.27 mt, 23.86 mt and 16.85 mt, respectively, from the previous year’s levels of 6.69 mt, 28.93 mt and 21.02 mt. Russia also faced dry and hot weather issues, cutting its sunflower oil exports from 3.83 mt in 2019-20 to 3.25 mt in 2020-21 (US Department of Agriculture, Grain and Oilseeds World Markets and Trade reports). Their smaller sunflower harvests started pushing up global vegetable oil prices from around September 2020. This was followed by the Russia government, in December 2020, issuing a series of decrees restricting exports of wheat, corn, sunflower and rape seeds, barley and rye in order to control domestic food inflation (https://bit.ly/3tJ8Uqp).
The pandemic’s impact was felt in Malaysia’s oil palm plantations, which, until April 2020, employed some 337,000 migrant labourers mostly from Indonesia and Bangladesh. Thousands of them flew home, as Malaysia closed its borders and stopped issuing new work permits to prevent the spread of Covid-19. With its plantations operating with about 75,000 fewer workers than needed (https://reut.rs/3n16Aak), Malaysia’s palm oil output fell to 17.85 mt in 2020-21, from 19.26 mt and 20.80 mt in the preceding two years (USDA). The war was the final straw. Supply disruptions from Ukraine and Russia triggered a wave of food export restrictions by countries concerned about inflation faced by their own populations. The most prominent example was Indonesia. The world’s largest palm oil producer and exporter, during February-March 2022, levied price controls, domestic sale obligations on exporters and finally tariffs on shipments (https://bit.ly/3y1SOur). For a brief period, between April 28 and May 23, it even slapped an outright ban on exports. Exacerbating these was drought in South America, with the USDA estimating the combined soybean production of Brazil, Argentina and Paraguay in 2021-22 to have fallen by 11.25% over the previous year.
India is probably one of the few countries that did not face any adverse weather events, at least in 2020-21. Bumper crops – both kharif (harvested mainly over October-December) and rabi (April-June) – led to record government purchases of rice (60.17 mt) and wheat (43.34 mt). Huge carryover stocks, in turn, enabled unprecedented quantities (55.06 mt rice and 50.55 mt wheat) to be sold under various welfare schemes in 2021-22 (financial year from April to March). The PDS turned out to be a savior – indeed, the only effective social safety net – during the pandemic, with the poorest states benefiting the most from the substantially stepped-up offtake of free/near-free grains (https://bit.ly/3n5nfcN). What’s interesting is that India in 2021-22 also exported record quantities of both rice (21.21 mt) and wheat (7.24 mt).
However, 2021-22 (the agricultural year from July to June) has been different. Rainfall during the southwest monsoon season (June-September) was normal on the whole. But the precipitation was irregular. Surplus rains in June, prompting brisk kharif sowings by farmers, were followed by a long dry spell from the second week of July till the third week of August. The period thereafter was marked by excess rainfall extending to all the subsequent five months till January. The kharif crop, thus, suffered first from moisture stress during the vegetative growth stage and, then, inundation at harvesting time. It did not stop there. Excess rains in January also affected yields of the rabi mustard that was in late-flowering stage. The culmination of these black swan (climate change?) events was the sudden spike in temperatures from mid-March, which took a toll of the wheat crop just when was in the final grain-filling stage (https://bit.ly/3tKqSbS). If March was bad for wheat, January was similarly so for mustard.
Conclusion
There are three broad takeaways from our analysis of the return of food inflation in India.
The first is the inflation being partly imported. The same factor – international prices – that kept food inflation low during Modi 1.0 has pushed it up in Modi 2.0. At the same time, this imported inflation has been disproportionately felt in edible oils and pulses. It hasn’t been so much in cereals, sugar and milk – commodities where India is self-sufficient and even in a position to export when global prices are high.
The second is the role of domestic supply shocks. These were, by and large, absent in 2020-21. But that wasn’t the case in 2021-22. While the National Statistical Office’s data shows the agriculture sector’s growth rate at 3%, on top of 3.3% in 2020-21, we have reasons to be skeptical. For, 2021-22 was a story
not only of the heat wave in March, but also of unseasonal rains from September to January. Both the kharif and rabi crops were impacted as a result. The double whammy of unseasonal rains and early summer also hit the production of mangoes and lemons, by causing flower drops and not allowing adequate time for fruit formation and growth. Had the intensity of the damage to wheat yields from the heat wave been properly understood and acknowledged, the government would in all probability have declared a bonus over and above the MSP. By not doing that, it left the field open for private millers and traders. They bought bulk of the wheat from farmers, paying slightly more, sensing both crop shortage and opportunities for exports. As the government’s own procurement plunged from 43.34 mt to under 19 mt in the current marketing season, it ended up doing what Indonesia and Russia had earlier done: Ban exports. This wouldn’t have been necessary if official procurement had even touched 25 mt.
The final point is to re-emphasize that there is nothing “structural” about the current inflation. Supply shocks, by their very nature, are temporary. While they may correct sooner than we would imagine, the more enduring problem of Indian agriculture – stalled dietary and cropping diversification, courtesy of weak income and demand growth – will remain and come to the fore.
This note has been authored by Samridhi Agarwal and Harish Damodaran.
Find all previous notes as part of the series here:
- Can rural play “savior” again? Agricultural seasons and COVID-19 waves by Mekhala Krishnamurthy and Harish Damodaran
- How ‘food’ has become the real social safety net in pandemic by Harish Damodaran
- Where is food inflation headed? by Harish Damodaran
- Has MGNREGS Helped the Rural Economy in 2021? by Yamini Aiyar, Avani Kapur and Harish Damodaran
- Employment U-turn: Rural India is India’s main employer by Harish Damodaran and Yamini Aiyar
- Carbohydrates to proteins and back: How dietary and cropping diversification seems to have gone into reverse by Harish Damodaran, Mekhala Krishnamurthy and Samridhi Agarwal
- Agricultural Households and Farming Income: An initial analysis of variations in income from farming and other sources among agricultural households in India by Harish Damodaran, Mekhala Krishnamurthy and Samridhi Agarwal
- Mapping India’s Livestock Economy by Samridhi Agarwal and Harish Damodaran
- The Future of MSP by Harish Damodaran
- Unlocking the Potential of Ganna Pradesh by Harish Damodaran