At least half of Delhi’s residents are estimated to be living in informal settlements, including jhuggi jhopri clusters, resettlement colonies, and unauthorised colonies. However, there is little assessment of their day-to-day experiences and interaction with state agencies.
The Cities of Delhi project at CPR addresses this critical need through its research, and, in particular, researcher Shahana Sheikh engaged in the public debate surrounding regularisation of unauthorised colonies in the lead-up to the Delhi election. Please find below a summary of this historical media outreach:
An op-ed on the lack of transparency in the regularisation of unauthorised colonies in Delhi.
Bringing in the policy perspective during a heated debate on NDTV Prime Time discussion on Delhi’s unregularised colonies.
Discussing multiple aspects of policies related to regularisation of unauthorised colonies in an interview with Ravish Kumar
Speaking on the ambiguities in the regularisation process of Delhi’s unauthorised colonies during an in-depth coverage of Kathputli Colony in Delhi.
With the aim of informing policy, the Cities of Delhi project will disseminate its findings during a two-day conference called ‘Urban Transformations in India’. For full details, visit the dedicated page and read an overview of the project findings in this report.
Listen to the 31st episode of the CPR podcast, ThoughtSpace (above) featuring Patrick Heller (Professor of Sociology and International and Public Affairs, Brown University) and Yamini Aiyar (President and Chief Executive, CPR).
ABOUT THE SERIES
The Citizenship Amendment Act (CAA) was recently passed in both houses of the Indian parliament, triggering large-scale protests across the country. What does the act mean for the future of Indian democracy? How do we understand the on-going protests and what are some of the political, economic and social implications of this movement?
In this mini-series curated by the CPR, we unpack these questions and shed light on what the next few months can have in store.
ABOUT THE EPISODE
The passage of the CAA led to agitations across the country. Since December 15, thousands of students, activists and ordinary people are out on the streets every day in every city. Latin American countries including Ecuador, Chile, Bolivia and most recently Colombia have experienced turmoil too. What are the parallels we can draw between the two regions? What do these protests say about the state of democracy across the world? And what are some of the lessons we can learn about peoples’ movements? In this episode, Yamini Aiyar speaks with Patrick Heller who sheds light on the subject.
This paper, authored as part of the New America US-India Public Interest Technologies Fellowship 2019, examines the privacy implications of drones in civilian airspaces. Though a technology with significant benefits, drones can also carry out extensive snooping and surveillance. As India transitions to a regulatory ecosystem supportive of drone technology, it is imperative that the attention of policy makers be directed to the various privacy harms that lie in store.
Here, the different kinds of harms are mapped into two: traditional privacy challenges arising from a spatial invasion by drones into private spaces, and big data risks on account of the business models that the drone industry has paved the path for. Dealing with the first category of risks, the paper argues that serious criminal enforcement, along the lines of what some States in the United States have pursued, is imperative to safeguard the private domain from the prying eyes of third parties. It also points out serious gaps in Indian constitutional jurisprudence when it comes to structural interventions like drone surveillance, and recommends an overall assessment of the impact on privacy baseline from such technologies when the judiciary evaluates their legality against the touchstone of the fundamental right to privacy. On the second kind of risk, the paper argues for privacy dashboards that help citizens evaluate the purpose of drone operations and assess whether equipments retrofitted alongside the drone are truly required to fulfil these purposes or merely meant to gather unrestricted amount of personal and community data.
By Santosh Harish, Shibani Ghosh and Navroz K Dubash
The Big Challenge
Air pollution levels are unsafe across the country, all-year round. While pollution levels spike to dangerously high levels during the winter in north India, those in several parts of the country are poor or worse for large parts of the year. High pollution levels are not restricted to cities; several industrial areas along with rural areas across the Indo-Gangetic plain are also polluted. There are several kinds of pollutants in the air: particulate matter, carbon monoxide, ozone, oxides of nitrogen and sulphur. Fine particulates (PM2.5) form a useful proxy indicator for air pollution. The population-weighted annual average concentration of PM2.5 across the country, estimated using satellite data, was 91 microgram/m3 in 2017 – more than twice the national standards.1
Air pollution is a public health emergency. The health impacts of poor air quality are staggering and of growing concern as we discover the full range and degree of its effects with new research. Air pollution is estimated to reduce the average life expectancy of a child born in India by 2.6 years.2 In 2017, air pollution is estimated to have contributed to one in eight deaths in India.3 Cardio-respiratory diseases and lung cancer in adults, and acute lower respiratory infections in children, are the more commonly known impacts of air pollution. In addition, new research indicates a much wider range of health impacts of air pollution such as on birth weight, child growth, obesity and bladder cancer. There is growing evidence on the adverse impacts of pollution on cognitive abilities in children.
Multiple sources contribute at different regional scales. Industries, power plants, vehicles, waste burning, road and construction dust, and household sources are significant sources of air pollutions. At the national level, household burning of polluting fuels for cooking and heating purposes form the single largest contributor to average PM2.5 exposure (in addition to the exposure to PM2.5 within these households themselves).4 Industries and power plants that burn coal are the second and third largest sources of exposure at the national level. Within cities, other sources like transportation, construction dust and waste burning play an important role. Because of these different geographical scales of influence, pollution control measures need to target different sources at appropriate levels. These different sources and scales make the role of the central government critical in framing policy at regional and national scales, coordinating implementation across states, and providing necessary financial and technical assistance.
The Existing Policy Framework
The National Clean Air Programme (NCAP), launched by the Ministry of Environment, Forest and Climate Change (MoEFCC) in January 2019, looms large over the newly elected government’s policy landscape. The NCAP identified 102 non-attainment cities – which have particulate matter levels that exceed the annual standards – and set a reduction target of 20-30% by 2024. However, in its approach, the NCAP is a status quo-its document, which adheres to city-specific templates from the past, and wholly misses addressing governance gaps. It reinforces India’s policy response to air pollution, which has largely been reactive and overly reliant on administrative solutions. The existing regulatory design has proved to be entirely inadequate to meet the scale of the problem, and the monitoring and enforcement capacity of government agencies (such as the pollution control boards) is insufficient, especially for dispersed sources of pollution like vehicles, stubble and waste burning. An effective air pollution control strategy must break away from the status quo, and instead strategically prioritize key, implementable actions.
Air pollution reduction needs greater commitment from the executive. So far, pollution control has largely been driven by the judiciary. The new government should assume leadership in crafting and implementing an effective national air pollution reduction strategy. This could take different forms. One important example is empowering and giving greater autonomy to pollution control boards (PCBs) to discharge their responsibilities and act against polluters. Currently, interference in the functioning of these boards is visible in multiple ways: (i) the boards are typically led by generalist bureaucrats despite court judgments that have backed domain experts for chairpersons and member secretaries;5 (ii) their funding is often dependent on grants-in-aid by the state governments; and (iii) routine administrative decisions like hiring need approval from the environment department. State PCBs also seem to be facing a trade-off between their functions of monitoring and enforcement, and promoting ‘ease of doing business’. All of these curtail their ability to discharge their statutory mandate effectively.
The new government should also enable resolution when there are complex political and economic factors contributing to a polluting activity. For instance, consider the case of stubble burning where Minimum Support Prices, groundwater management, farm mechanization, the agrarian crisis, and unfavourable meteorology all contribute to episodic peaks in pollution in north India. Banning burning or subsidizing technical solutions such as ‘Happy Seeders’ are unlikely to solve the problem, unless some of the structural factors mentioned above are tackled through political negotiation.
A New Policy Agenda
Strengthening the National Clean Air Programme (NCAP)
NCAP was a missed opportunity to outline a systematic strategy. Beyond the national outreach and the reduction targets, it is a compilation of ongoing efforts, and leaves the details of new efforts to future action plans. Specific gaps include:
NCAP is largely a continuation of the traditional policy approach of developing long lists of unprioritized action points. It does not put implementation capacity at the heart of designing our mitigation policies, thus risking non-implementation.
The programme is urban-centric, focusing on a limited group of cities, and following the National Capital Region template by relying on city action plans. However, air pollution is not restricted to cities, and air quality in cities is typically influenced significantly by sources from outside. Addressing this problem requires moving the conversation towards addressing pollution at regional ‘airshed’ levels, and having more flexible system boundaries for air pollution control. The NCAP does not outline a road map for defining these airsheds and developing processes that cut across jurisdictions and departments.
NCAP misses addressing governance gaps directly. It introduces new committees at the central and state levels, and declares that individual ministries will ‘institutionalise’ action points in their charge. However, it does not specify what institutionalizing entails, and who would be held responsible if targets are not met, and what legal or financial implications would follow.
To strengthen the NCAP, there is a need to focus efforts on a prioritized shortlist of solutions in the short term, improve the enforcement capacity of the PCBs while increasing their accountability, and begin extensive consultations about governance reforms needed in the longer term. We elaborate on these below.
Prioritizing concrete actions
Given the number of sources that contribute to the problem, and the many mitigation efforts needed (several of which are included within NCAP), how do we prioritize policy efforts? Prioritizing solutions needs active consideration of the implementation capacity needed to introduce measures and enforce them. In addition, we need to ensure that the programme does not adversely impact vulnerable groups.
In particular, with dispersed sources of pollution, such as transportation, households, waste burning and construction dust, administrative solutions that require monitoring and enforcement are likely to fail. Instead, enforcement could work better for policy changes targeted at higher, more centralized levels, where possible. For instance, with vehicles, although there is a pollution control mechanism in place, several issues inhibit inspections from being a reliable way to keep the on-road fleet within standards. These include low rates of compliance among vehicle owners in getting tested and compromised inspections (poor calibration of testing equipment and corrupted inspection results). Policy changes aimed higher up in the manufacturing process, such as the requirement to comply with Bharat Stage VI norms, are likely to be better implemented.
Keeping these factors in mind, three key priority areas within the NCAP are identified below.
Power plant emission norms
India’s formal regulatory infrastructure has traditionally focused on ‘point sources’, with good reason. Industries and power plants burning coal are the second and third largest sources in India (only behind the numerous but highly dispersed household sources of emissions), in terms of contributions to average national exposure to air pollution and the resultant burden of disease. Power plants are the largest source of sulphur dioxide and a major source of nitrogen oxide. Sulphur and nitrogen oxides are key precursors that react with other substances to produce secondary particulate matter. MoEFCC introduced new emissions standards for power plants in 2015, which required the installation of pollution control equipment. Although the power plants were required to comply with these standards by 2017, the Central Pollution Control Board (CPCB) later announced that the compliance date had been pushed to 2022, as per a timeline prepared by the Central Electricity Authority. Ensuring that these standards are complied with, and the requisite control equipment installed by this revised timeline, if not at an accelerated rate, is critical.
Revamp Ujjwala to increase LPG use
The Pradhan Mantri Ujjwala Yojana (Ujjwala) is an important initiative. While primarily an energy access programme, it has also tackled household solid fuel use, which is the largest contributor to pollution exposure in India. Ensuring universal continued usage of clean cooking fuels should therefore be a critical pillar of our air pollution control efforts. To facilitate continued usage of LPG, the government needs to ensure that prices are affordable for the beneficiaries, and in parallel, run campaigns to change behaviour and attitudes. This is unlikely to be a rapid transition, but some important first steps have been taken.
Invest in public transportation
Reducing transportation emissions would require a combination of ensuring easy access to affordable public and non-motorized transport, while simultaneously working on reducing emissions from the vehicles on the road. Investments in clean public transport can reduce transport emissions as well as make mobility easier and cheaper, thereby improving the quality of life in cities. Planning the public transit strategy for the long term is key.
Strengthening regulatory capacity
The formal air pollution regulatory architecture in India is built around the Air (Prevention and Control of Pollution) Act, 1981, the Environment (Protection) Act, 1986, and rules and notifications issued under these. As per existing law, the state PCBs have very limited flexibility to take action proportional to the polluting activity.7 Currently, they can send show cause notices, shut down industries through a closure notice or by shutting access to utilities, cancel regulatory consents, or initiate criminal prosecution by taking the industries to court. With court cases taking several years to reach any meaningful conclusion, PCBs rarely pursue this route, and restrict themselves to either a rap on the wrist through show cause notices, or shut down the industries – making enforcement expensive and ineffective.
Strengthening the ability of the PCBs to tackle point sources could provide a pathway to a broader reform process. In the long term, India needs a modern environment governance structure with teeth, nimbleness and resources to plan and drive a multi-sectoral strategy. NCAP is largely silent on how this structure could look, and on a road map for reforms. We outline below near-term and long-term milestones to strengthen regulatory capacity.
In the near term, PCBs must be resourced better, and in parallel, be made more accountable through disclosure efforts.
Increased resources of PCBs: Human resources currently available in PCBs are not sufficient to meet their mandate. There is a need to rapidly expand their capacity, particularly on the technical side. In the short term, existing vacancies in the CPCB need to be filled with qualified people. Working with CPCB and the states, filling up vacancies in the state PCBs should be another area of priority. Increased staff resources should translate to increased inspections and monitoring.
Increased accountability through public disclosure of regulatory data: The operations of the PCBs are extremely opaque, and it is unclear to the public where the big polluting sources are, and whether they are compliant with regulatory norms. Ensuring that PCBs release regulatory information (details of consents granted, inspections, online monitoring data, enforcement actions, etc.) into the public domain would make the industries and state PCBs more accountable to local communities, civil society and the media.
Longer-term reforms will require extensive dialogue; therefore, it is important for the government to start deliberations early. We outline below three broad elements for change that should be considered in the reforms process.
Remove legal barriers for effective enforcement: There is a need for statutorily empowering PCBs so that they can initiate systematic and proportional responses to polluting activities. Amending the law to allow for a more diverse regulatory toolbox, which includes both existing powers and additional ones such as levying financial penalties, would increase the flexibility of the PCBs and make them more responsive.
Institutionalized airshed-level management: Tackling air pollution effectively requires looking beyond administrative boundaries and focusing on reducing emissions across the ‘airshed’ over which pollutants disperse. This will need new modes of coordination across city and state administrations, and across line departments; it may also require the creation of new authorities with wider jurisdictions. Airshed level regulation will require a regulatory rethink and would involve extensive consultations which should commence on priority.
Development of a sector airshed approach: The long-term strategy will need a careful application of sectoral approaches at the airshed level, or the national or state level, which utilize an appropriate combination of administrative, technical, economic and behavioural solutions.
Concluding Remarks
Air pollution is a complex problem, with multiple sources operating at different regional scales, under the jurisdictions of disparate agencies, and requiring a variety of mitigation measures. We need to unambiguously acknowledge the terrible impacts of air pollution on our health, move beyond the urban-centric approach, and tackle each of the big sources with a sense of urgency. The policy for tackling air pollution needs to shift from the reactive approach we have taken so far to one that is more systematic: focusing on some efforts in the near term, and beginning the process to reform our environment institutions to make them better resourced as well as more nimble and effective in the longer term.
Other pieces as part of CPR’s policy document, ‘Policy Challenges – 2019-2024’ can be accessed below:
The Future is Federal: Why Indian Foreign Policy Needs to Leverage its Border States by Nimmi Kurian
Rethinking India’s Approach to International and Domestic Climate Policy by Navroz K Dubash and Lavanya Rajamani
India’s Foreign Policy in an Uncertain World by Shyam Saran
Need for a Comprehensive National Security Strategy by Shyam Saran
A Clarion Call for Just Jobs: Addressing the Nation’s Employment Crisis by Sabina Dewan
Time for Disruptive Foreign and National Security Policies by Bharat Karnad
Multiply Urban ‘Growth Engines’, Encourage Migration to Reboot Economy by Mukta Naik
Schooling is not Learning by Yamini Aiyar
Protecting Water while Providing Water to All: Need for Enabling Legislations by Philippe Cullet
1 Health Effects Institute, ‘State of Global Air 2019’, http://www.stateofglobalair.org/.
2 Ibid.
3 K. Balakrishnan et al., India State-Level Disease Burden Initiative Air Pollution Collaborators, ‘The Impact of Air Pollution on Deaths, Disease Burden, and Life Expectancy across the States of India: The Global Burden of Disease Study 2017, Lancet Planet Health 3: e26–e39 (2019).
4 S. Chowdhury et al., ‘Indian Annual Ambient Air Quality Standard is Achievable by Completely Mitigating Emissions from Household Sources’, Proceedings of the National Academy of Sciences of the United States of America 116(22): 10711-10716 (2019).
5 See, for example, Techi Tagi Tara v Rajendra Bhandari & Ors (2018) 11 SCC 734.
6 GBD MAPS Working Group, ‘Burden of Disease Attributable to Major Air Pollution Sources in India’ (Health Effects Institute, 2018).
7 S. Ghosh, ‘Reforming the Liability Regime for Air Pollution in India’, Environmental Law and Practice Review 4 (2015): 125-146.
FULL VIDEO OF THE SEVENTH EVENT IN THE SERIES
AIR POLLUTION
Watch the full video (above) of Anumita Roychowdhury in conversation with Dr Navroz K Dubash examining the kinds of strategies that have been effective in improving Indian air quality regulation and governance. Anumita discusses the major turning points in the campaign for clean air and the challenges faced in implementing mitigation actions. While emphasising on the role of scientific evidence, the judiciary, and public awareness, as well as the need to mobilise key actors for change, Anumita shared lessons learnt along the way and stressed on the need to re-envision the policy challenge of air pollution in an integrated manner.
About the Panelists:
Anumita Roychowdhury is the Executive Director – Research and Advocacy, and Head of Air Pollution and Clean Transportation Programs at the Centre for Science and Environment, New Delhi. She co-authored the book ‘Slow Murder: The deadly story of vehicular pollution in India’ in 1996 that catalysed the Right to Clean Air campaign in India. She has written and spoken extensively on air pollution and issues relating to transport. Over the years she has participated in many global and national forums on environmental issues and is also associated with various regional networks on air pollution and transportation. In 2016 she was awarded the Haagen-Smit Clean Air Award for 2016 (in the category of International Air Pollution Policy) by the California Environmental Protection Agency.
Dr Navroz K Dubash is a senior fellow at CPR and coordinator of the Initiative on Climate, Energy, and Environment. His research and policy interests include climate change policy and governance, the political economy of energy and water, the regulatory state in the developing world and the role of civil society in global environmental governance. In 2015 he was conferred the 12th T N Khoshoo Memorial Award in recognition of the impact of his work on Indian climate change policy and the international discourse on global climate governance.
This is the seventh event in the Clearing the Air Seminar Series, organised by the Initiative on Climate, Energy and Environment (ICEE) at the Centre for Policy Research (CPR). The series aims to promote sustained and informed public understanding around the data, impacts, sources and policy challenges involved in clearing Delhi’s air. While it focuses on the context of Delhi, the series also reflects on the fact that the problem extends far beyond Delhi. The seminar series presents the work of experts in a range of areas to help promote informed public discussion about what changes are needed, what is possible, and how to get it done. Clearing the air in terms of knowledge and public information, we hope, will make a small contribution toward actually clearing Delhi’s air. Information about previous events held as part of the Series can be found here.
The question and answer session that followed the conversation between the panelists can be accessed here.
The contemporary urbanisation paradigm in India is rooted in a visible growth of urban areas beyond large cities, a trend that is distinctly evident since the 2011 census. A lot of these urban areas are only defined but not governed as urban, and are known as census towns (CTs). Beyond summing up salient features of these towns, this paper tries to highlight the future trajectory of these areas, in order to outline what factors will drive these areas in future, and how policymakers and the state will respond to various demands of these places. Some important findings of this paper are highlighted below, through a short discussion with the authors.
In this paper, you have tried to predict the number of census towns for the upcoming census. How can you do such an exercise for the 2021 census now, in 2018?
In order to answer the question, let us look at the different steps that are involved in the classification of rural and urban areas in a census. The Registrar General of India (RGI) actually uses data from the last census for making such classifications. For example, the 2001 settlement data was used as the reference data for the 2011 census. The first step is to take note of the jurisdictional changes to villages and statutory towns (STs) that occurred in between two censuses. Statutory towns are urban areas established under a state or central law and are governed by urban local bodies. Since between 2001 and 2011, state governments formed new STs, and geographical area of the existing STs also underwent changes (mostly increased), it is important to adjust these changes for the 2011 census data. Similarly, new villages also came up during this period.
Once the list of STs is finalised, the second step involves identification of census towns (CTs). For that, the RGI takes the data from the last census (i.e., 2001 data for 2011 Census), and sees how many villages satisfy three pre-defined conditions to become CTs. The three conditions are: (i). population of 4,000 and more, (ii). population density of at least 400 persons per square kilometer and (iii). male non-farm workforce of more than 75 percent. Note that the population used is 4000 and not 5000, as in the definition of an urban area. This is because the RGI presumes the reduced population cut-off of 4000 should increase to 5000 during the intercensal period.
Since the previous census data is used for identification of CTs, one can use the existing 2011 census data to predict the number of CTs for the upcoming 2021 census.
Why does the Census make such classification before the census?
The tradition of identifying CTs before the census has been followed since the 1961 census. It is important to ask whether there are enough reasons to support the current approach of identifying CTs using previous census data instead of identifying CTs after the Census, using the actual census data. In our paper, we have shown how this method can lead to misclassification of CTs; i.e. 736 villages which were identified as CTs do not fulfill the criteria in the actual data and similarly 1400 villages actually fulfill the criteria but were not identified as CTs.
On the other hand, the current approach could be supported on two angles. Firstly, the set of information collected from the rural and urban areas is not exactly same. There is some information which is collected specifically from rural areas (such as information related to land use, irrigation, roads, Public Distribution System, nutritional and child care facilities etc.) and other information which is only collected from urban areas. As a result, classification of a settlement into either rural or urban has to be done before the census so appropriate information can be collected. Secondly, finalising rural and urban frame before the census also helps in releasing the rural and urban population data much faster.
What are the challenges in such estimation?
The main challenge in estimating the number of CTs from the census data is due to the paucity of information in the census data. The census manual indicates that the workers who belong to the “Plantation, Livestock, Forestry, Fisheries, Hunting and allied activities” (PLFFH) sector must be treated as farm employment in the identification of CTs. But, since the 2001 census, village level workforce data is available in four broad groups where PLFFH workers are clubbed in a group that is primarily a non-farm sector. As a result, some type of adjustment is required and there are limitations to it.
Besides identifying villages that you are expecting to become census towns in the coming 2021 census, are there any new findings in this paper?
This work is based on our previous work on census towns. A number of researchers from Centre for Policy Research (CPR) as well as our collaborators have worked on various aspects of CTs in the past. One important aspect that we have focused on in our previous work is the extent to which proximity to urban areas plays a role in the formation of CTs and its relation to their characteristics. In this paper, we have tried to delve deeper into the spatial characteristics of CTs. For example, even if a CT is not proximate to a large town it is important to know whether it is a standalone CT with a more local economic interaction or part of a cluster of CTs where agglomeration economies may come into play. Similar classifications can also be made for proximate CTs.
Are these census towns more like villages or like towns?
There can be different answers to the same question depending on what we are comparing. We can compare intensity of non-farm activities, economic prosperity of citizens, structure of the society or provision of public services etc. In this paper, we have used some indicators related to access to public services and private assets, as well as intensity of night-time light data (i.e. satellite image of the earth at night) to capture the levels of economic activity. For all these indicators, we found that CTs are better than villages of similar population size and for some indicators they are comparable with smaller STs.
What are the policy implications of such large number of upcoming CTs on the governance of these settlements?
It has been mentioned earlier that while CTs are governed like other villages in the country, they are counted as urban, and their economic characteristics are different from their rural counterparts. As mentioned, CTs in a large number are expected to be added to the already existing stock in the upcoming census. So, planned governance of these settlements is crucial for their sustained economic growth. While the current policy discourse does not offer anything specific regarding CTs, the Central Government in a recent advisory asked the states to consider converting them into STs. Other than the fact that such conversion is a variedly contested process, the diverse nature of CTs highlighted in this paper questions the ‘one-size-fits-all’ approach and prescribes a more integrated approach from the State.
The working paper can be accessed here.
Additional research on census towns at Centre for Policy Research can be accessed here.
FULL ACCESS TO THE JOURNAL ARTICLE, CO-AUTHORED BY NAVROZ K DUBASH
CLIMATE RESEARCH PARIS AGREEMENT
A recent article by Robiou du Pont et al. suggests that wealthier countries (for example, the members of the EU) have made more ‘equitable’ contributions to the Paris goals than poorer countries (such as India and China), with most other developing countries somewhere in between. These results are counter-intuitive, given that developed countries have the majority of the responsibility for the atmospheric build-up of Greenhouse Gases (GHGs) and the majority of the financial wherewithal to help solve the climate problem, yet their Paris pledges amount to fewer tons of mitigated emissions than developing countries. This correspondence presents a response to du Pont et. al and points out the biases towards wealthier nations in the approach and methodology adopted.
Across the globe, the “development experience” of communities varies depending on their socioeconomic and political backgrounds. As a result of advancing developmental projects, a few communities are invariably made to pay a disproportionate share of the environmental costs in the form of exposure to toxic waste, loss of livelihood, and restrictions on mobility or access to common resources. This injustice, more than often not, is an outcome of active noncompliance and violation of environmental regulations by the projects .
The Centre for Policy Research–Namati Environmental Justice Program is an effort towards closing this environment regulation enforcement gap. We have created a network of community-based paralegals, called as enviro-legal coordinators (ELCs), who work with affected communities using an evidence-based legal approach. As a part of this approach, the ELCs combine their understanding of the law, negotiation and mediation skills, and understanding of local contexts to assist affected communities in the use of the law to resolve environmental conflicts. They help the communities to understand relevant laws and environmental regulations and support them in engaging with institutions using these laws for better enforcement of regulatory compliance on the ground. This approach also develops a collaborative space for institutions and citizens to craft practical and sustainable remedies for the impacts that communities experience.
This publication is a compendium of a few cases undertaken by the CPR–Namati Program’s ELCs working across the coastal belt in Gujarat and North Karnataka. These case stories capture the process of our work and illustrate the systematic, evidence-based legal approach followed by the ELCs along with the affected coastal community members to resolve conflicts arising from noncompliance or improper implementation of environmental regulations.
These case stories are divided into three major thematic sections as follows:
Section 1: Establishment and Activation of Gujarat’s District-Level Coastal Committees (DLCCs) as per Coastal Regulation Zone (CRZ) Notification, 2011: This section includes case studies from Gujarat, where ELCs worked towards establishing or activating District-Level Coastal Committees, an institution set up for better implementation of CRZ regulations and protection of rights of traditional coastal communities.
Section 2: Securing Housing Clearances for Coastal Communities under Coastal Zone Regulation Notification, 2011 in North Karnataka: This section includes case studies from Uttara Kannada, a district in North Karnataka, where ELCs supported members of coastal communities in securing housing clearances under the coastal protection law.
Section 3: Legal Empowerment in Practice: Two Case Stories: This section has two case stories from our field sites in Gujarat that illustrate the process and outcomes of legal empowerment though our work with communities.
Click here to access the full publication by CPR- Namati Environmental Justice Program.
In 1997, McKinsey & Company and the Confederation of Indian Industry released a report on how India, over the next 20 years, would see a shift in the “centre of gravity” in its food consumption patterns from ‘subsistence’ to ‘basic’ foods. The report didn’t precisely define ‘subsistence’, but the reference was to cereals, sugar and other foods that basically deliver calories and secure the “basis of survival”. The ‘basic’ category, on the other hand, encompassed foods rich in proteins, such as milk and dairy products, egg, meat, fish and chicken
The CII-McKinsey study – Food & Agriculture Integrated Development Action or FAIDA, as it was called – drew upon cross-country evidence to demonstrate that the consumption of ‘basic’ foods begins to grow rapidly when the ‘subsistence’ category plateaus. They found that the inflection point for this is usually at per capita incomes above $1,000 in purchasing power parity (PPP) terms. India’s per capita GDP, then, was only around $415 in current US dollars, but had crossed $1,750 at PPP (https://bit.ly/3ksIlC7). It had already, therefore, reached the threshold where “with rising incomes, what is considered good food comes to accommodate greater diversity”.
The FAIDA report’s prophesy was borne out by household consumption data from the National Sample Survey (NSS) rounds for subsequent years. If ‘basic’ foods are understood to also include fruits and vegetables – these are high in micronutrients, viz. vitamins and minerals – it can be seen that the per capita consumption of all of them have increased, both in urban and rural areas. The resultant diversification of diets – from calories/energy-based to incorporating proteins and micronutrients – is perceptible particularly in the period from 2004-05 to 2011-12 (see tables below)
Per capita consumption of various foods over 30 days: Rural
1993-94
1999-2k
2004-05
2011-12
Cereals (kg)
13.40
12.72
12.12
11.22
Pulses (kg)
0.76
0.84
0.71
0.78
Milk (litres)
3.94
3.79
3.87
4.33
Eggs (number)
0.64
1.09
1.01
1.94
Fish (kg)
0.18
0.21
0.20
0.27
Chicken (kg)
0.02
0.04
0.05
0.18
Goat meat (kg)
0.06
0.07
0.05
0.05
Edible oil (kg)
0.37
0.50
0.48
0.67
Tomato (kg)
0.29
0.35
0.34
0.59
Onion (kg)
0.46
0.58
0.56
0.84
Potato (kg)
1.24
1.61
1.33
1.97
Banana (number)
2.20
2.48
2.37
4.18
Mango (kg)
0.06
0.10
0.09
0.16
Per capita consumption of various foods over 30 days: Urban
1993-94
1999-2k
2004-05
2011-12
Cereals* (kg)
10.60
10.42
9.94
9.28
Pulses* (kg)
0.86
1.00
0.82
0.90
Milk (litres)
4.89
5.10
5.11
5.42
Eggs (number)
1.48
2.06
1.72
3.18
Fish (kg)
0.20
0.22
0.21
0.25
Chicken (kg)
0.03
0.06
0.09
0.24
Goat meat (kg)
0.11
0.10
0.07
0.08
Edible oil (kg)
0.56
0.72
0.66
0.85
Tomato (kg)
0.46
0.55
0.53
0.81
Onion (kg)
0.56
0.72
0.72
0.95
Potato (kg)
1.08
1.32
1.14
1.61
Banana (number)
4.48
5.00
4.14
6.69
Mango (kg)
0.12
0.16
0.11
0.20
Note: *Includes cereals and pulses products.
Source: National Sample Survey Office.
The tables suggest significant dietary diversification over time, with per capita consumption of cereals declining and that of ‘basic’ foods – containing proteins (milk, eggs, fish and chicken) as well as fat (edible oils) and micronutrients (vegetables and fruits) – going up. Moreover, there was an acceleration of this trend post 2004-05. Pulses and mutton are exceptions here and we will discuss their case again a little later.
The underlying driver of dietary diversification during this period has been incomes. That household consumption tends to shift from ‘inferior’ to ‘superior’ foods with rising incomes is a well-known trend (the FAIDA report talked of ‘subsistence’, ‘basic’ and also ‘premium’ foods. The estimated take-off threshold for the latter was at $7,500 per capita PPP incomes; India’s per capita GDP was $7,000 at PPP and $2,100 at current dollars in 2019). A classic example of a ‘superior’ food is milk, a vital source of animal protein in a country with a substantial lacto-vegetarian population. As incomes rise, the share of milk and dairy products in their total food spend tends to go up, while decreasing for cereals. This can be seen from the shares of the two items in the monthly per capita value of food consumption across different fractile classes (from bottom to top). In rural areas, the value of milk consumption overtakes cereals by the 10th fractile class, while earlier, at 7th, for urban India.
% Share of per capita value of food consumption: 2011-12
Fractile Class
Cereals
Milk & dairy
Rural
Urban
Rural
Urban
01
32.64
28.61
5.59
9.15
02
30.25
24.15
7.92
11.61
03
28.18
22.48
10.27
13.45
04
26.13
20.54
10.83
15.03
05
24.43
18.76
12.60
15.98
06
22.61
17.65
13.80
16.82
07
21.38
17.03
14.29
17.56
08
19.96
15.93
15.55
17.68
09
18.82
14.86
16.59
18.22
10
17.07
13.50
18.44
17.59
11
15.06
11.46
19.62
17.88
12
12.20
7.91
18.73
14.72
Average
20.33
15.62
15.19
16.44
Source: ‘Household Consumption of Various Goods and Services in India 2011-12’, NSS 68th Round (July 2001-June 2012).
Rising from below
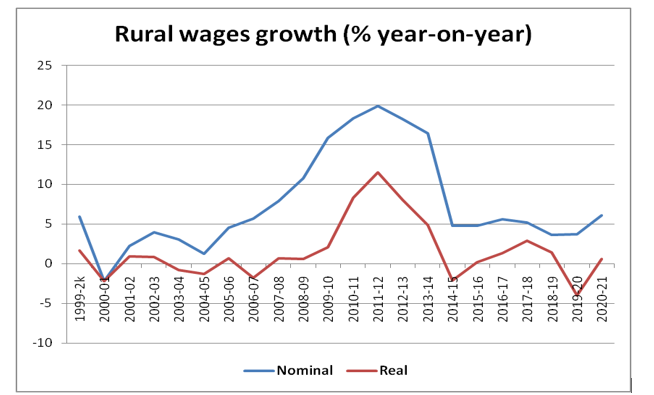
Proof of incomes rising, including at the bottom fractiles/deciles, is rural wages. The accompanying chart shows wages registering considerable growth, both in nominal and inflation-adjusted real terms, from roughly the mid-2000s till around 2013-14, before decelerating thereafter.
Nominal wages are simple arithmetic all-India average for rural male labourers across 25 agricultural and non-agricultural occupations; for calculating real wages, the Consumer Price Index for Rural Labourers has been used.
Source: Labour Bureau.
Landless rural daily wage farm and non-farm labourers traditionally occupy the bottom-most rungs of Indian society. During the seven years from 2007-08 to 2013-14, their nominal wage rates grew by 15.3% per year on an average. But what made this period truly unprecedented perhaps was real rural wages, too, recording an average annual growth of over 5.1%.
The increase in incomes, especially of poor and lower-middle class households, would have been a major contributor to the accelerated trend of dietary diversification, evident from the NSS consumption data between 2004-05 and 2011-12. Praduman Kumar et al (https://ageconsearch.umn.edu/record/109408/?ln=en) have estimated the income elasticity of demand for milk in India at 1.64, with these even higher for the “very poor” (2.342), “moderately poor” (2.018) and “non-poor lower” (1.773) households. Every 1% rise in household incomes, thus, generates an average 1.6%-plus additional demand for consumption of milk and milk products. But it isn’t dairy alone: The NSS data reveals per capita consumption of eggs nearly doubling between 2004-05 and 2011-12, while trebling for chicken. Many lower-income households would also have added more fresh produce such as vegetables along with roti and rice to their diets.
A corollary to dietary diversification has been cropping diversification. It can be seen from the table below that India’s output of livestock and horticultural products has shot up anywhere from three (milk, vegetables and fruits) to nine (poultry meat) times since 1990-91, as against hardly 1.1-2 times for cereals, sugar and pulses. Much of this is, again, really reflected only after 2000-01.
All-India production in million tonnes
1990-91
2000-01
2015-16
Milk
53.92
80.61
155.49
Eggs*
21.10
36.63
82.93
Poultry meat
0.36
0.86
3.26
Vegetables
58.53
88.62
169.06
Fruits
28.63
43.00
90.18
Cereals
162.13
185.73
235.22
Pulses
14.26
11.08
16.32
Sugar
12.05
18.51
25.13
*In billion numbers.
Source: Departments of Agriculture, Animal Husbandry & Dairying and Food & Public Distribution.
Three points are worth highlighting here.
The first one is that the above production increases appear to have been supply responses to demand. Second, such responses were the strongest in crops/products where production-enhancing technologies existed. These included seeds/genetics (tissue-cultured plants in banana, hybrids in vegetables as well as maize and fodder grasses for livestock, artificially inseminated crossbred cows, and commercial broilers and layer birds) and agronomy (drip irrigation, laser-leveling, raised-bed planting and high-density cultivation), chemistry (new crop protection chemicals and water-soluble/specialty fertilisers). Their diffusion was further enabled by better roads and availability of three-phase power, making it easier to access markets and viable to invest in irrigation systems, bulk milk coolers, cold stores and deep freezers.
The third point relates to the role of the private sector. The Green Revolution in cereals or breeding of high-yielding sugarcane varieties was mostly the effort of the Indian Council of Agricultural Research and state agricultural universities, while also accompanied by government procurement/enforcement of minimum support prices. The increasing production achieved in horticulture and poultry, by contrast, were in significant measure due to private corporations, such as Jain Irrigation, Syngenta, Bayer, Monsanto, DuPont, Mahyco, Venkateshwara Hatcheries and Suguna. Even in the case of milk, the National Dairy Development Board’s Annual Report for 2010-11 conceded that “it is estimated that the capacity created by them (private sector players) in the last 15 years equals that set up by cooperatives in over 30 years” (https://bit.ly/3kNm2XN).
Another important example of technology and integration is poultry where there was adoption of hybrid Ross-308/Cobb-500 broilers and BV-300-layer birds. There were also large integrated poultry firms supplying not only day-old-chicks, but even feed, medicines and vaccines, to farmers. Similar technology-driven changes in production did not take place in goat and sheep meat, nor with desi breeds such as Kadaknath and Chittagong.
On the other hand, the limited hybridisation possibilities in pulses and oilseeds elicited little interest from private seed companies. Not surprisingly, the supply response to increased consumption demand for vegetable proteins and fat took the form of surging imports rather than domestic production. Between 2000-01 and 2015-16, India’s edible oil imports soared from 4.2 million tonnes (mt) to 15.6 mt. So, did that of pulses, from 0.4 mt to 5.8 mt. This is where the lack of serious public investment in agricultural R&D for oilseeds and pulses has played an important role in India’s dependency on increased imports of edible oils and pulses.
Recent trends
Unfortunately, the picture after 2015 is hazy. To start with, there isn’t any published NSS household consumer expenditure (HCE) survey data after 2011-12. The large sample-size quinquennial HCE surveys (the 68th round for 2011-12 had 101,651 households from 7,649 villages and 5,268 urban blocks across the country) are the most credible source on the monthly per capita consumption of different foods, both in quantity and value terms, over time. The National Statistical Office did undertake an HCE survey for 2017-18 (July-June), but its results weren’t released, ostensibly in view of “data quality issues” (https://bit.ly/3fFfJ55).
The absence of any published NSS HCE information after 2011-12 means we know little on how much dietary diversification has taken place, if at all, in the more recent period. Has the accelerated trend of diversification, noticeable during the 2004-05 to 2011-12 period, continued, stalled or maybe reversed? The 2017-18 HCE survey could have shed some light; unfortunately that data is not publicly available.
But there are some things that we do know.
The first relates to rural wage rates. These, as already seen, grew by an average 15.3% per year in nominal and 5.1% in real terms during the seven years from 2007-08 to 2013-14. The subsequent seven years from 2014-15 to 2020-21, however, recorded a nominal yearly growth of just 4.8% and virtually zero after factoring in inflation. If rural wages are a proxy for incomes of the lowest decile households, these have hardly risen in real terms. Going by the past relationship between incomes and dietary patterns, this would have likely had some negative impact on the demand for protein- and micronutrients-rich foods.
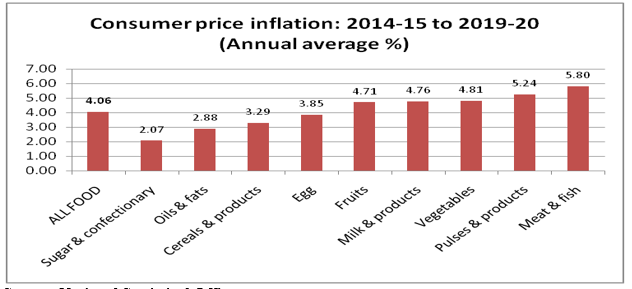
The second has to do with inflation. During 2014-15 to 2019-20, overall consumer price index inflation averaged 4.5% a year, while lower, at 4.1%, for food and even more so in sugar, edible oils, cereals and egg. There was no real “protein inflation” in pulses, milk, meat and horticultural products either. This appears to be a contrast to earlier arguments that protein inflation would be an inevitable consequence of the surge of rising incomes across the population driving increasing demand for proteins. The former Reserve Bank of India deputy governor Subir Gokarn, in a late-2010 paper, estimated that a 39% growth in real per capita incomes between 2004-05 and 2009-10 resulted in the diets of an additional 220 million Indians shifting “decisively” towards higher consumption of proteins. “Increasing demand for proteins appears to be an inevitable consequence of rising affluence,” he wrote, while warning of persistent demand-supply imbalances that would make pulses, milk, eggs, fish and meat much more costly down the line (https://bit.ly/3jAfn0X). The chart below suggests little materialisation of those fears, at least in the most recent period. It would be worth exploring the role of changing incomes and demands in the benign inflationary outcomes story.
Source: National Statistical Office.
A third indicator pertains to demand. The table below provides data on liquid milk sales by cooperative dairies. These posted an annual growth rate of 5.9% between 2001-02 and 2007-08, rising to 7.6% for 2008-09 to 2013-14. But the compound annual growth during the subsequent six-year-period to 2019-20 fell to 3.9%. This wasn’t due to private dairies faring any better or grabbing market share from cooperatives. Published financial information on 12 major private dairy companies shows their combined sales revenues going up from Rs 13,634.31 crore in 2014-15 to Rs 16,770.35 crore in 2018-19, translating into an annual growth of 5.3% in nominal terms and even less after adjusting for inflation. The so-called private sector’s White Revolution was a post-liberalisation phenomenon that tapered off by 2014-15, with the collapse of global milk powder and fat prices. The companies that have continued to do well are the few focusing on branded liquid milk and consumer products marketing, as opposed to the more volatile dairy commodities business.
Milk sales versus production
Liquid milk marketing by cooperatives*
Milk Production**
2001-02
134.23
84.41
2007-08
189.60 (5.92)
107.93 (4.18)
2013-14
294.44 (7.61)
137.69 (4.14)
2019-20
370.77 (3.92)
198.40 (6.28)
Note: *lakh litres per day; **million tonnes; figures in brackets are six-year compound annual growth rates.
Source: National Dairy Development Board and Department of Animal Husbandry & Dairying.
If sales of organised cooperative and private dairies are anything to go by, the growth in demand for milk and milk products has clearly slowed. It then raises questions on official milk production statistics that point in the opposite direction. This apparent incompatibility between demand deceleration and output acceleration is something only the findings from a fresh NSS HCE can plausibly resolve.
One other data source, which could give some idea of food consumption patterns for the recent period, is the Centre for Monitoring Indian Economy’s Consumer Pyramids Household Survey (CPHS). A longitudinal panel survey covering an all-India sample of 170,000-odd households, it tracks their monthly expenses on 153 items, out of which 43 relate to food.
The advantage with the CPHS is that it has monthly data on household expenditures, both food and non-food, from January 2014. But there are also disadvantages of not all households reporting their consumption every month. What we found from the raw CPHS data was the average household reporting for only 4-6 months in a year. And since each of them reported/non-reported data for different months, it makes calculation of the average expenditure by all households on a particular item, food or non-food tricky. A more serious shortcoming of the CPHS, though, is that it deals exclusively with values – how much money a household spends every month on whole-grain cereals, how much on dal (whole and split pulses), on milk and milk products, on edible oils, and so on. There is no information on the quantities of such items purchased or consumed by the household. The CPHS, to that extent and unlike the NSS HCE surveys, does not tell us much about dietary diversification, which is ultimately about quantities as against only expenditure values.
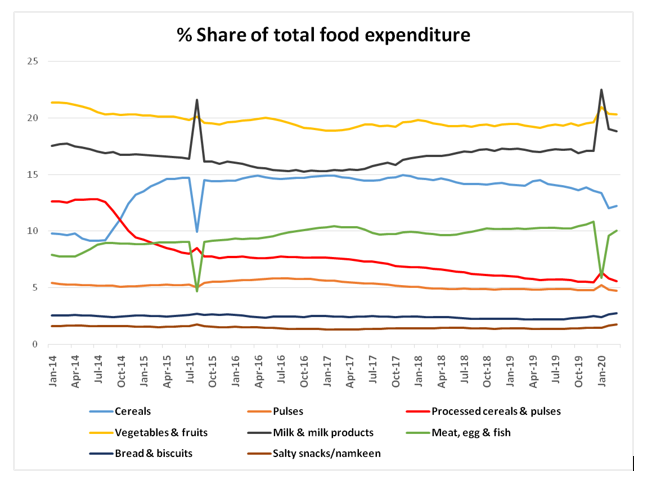
Within those limitations, what are the results that the CPHS dataset throw up for us to consider? We have taken the average expenditure of all households on different foods as a percentage of their total food spends. These shares have been worked out for all the months from January 2014 to March 2020 (see chart below). Like before, we have confined our analysis to the period before the Covid pandemic and the national/state-level lockdowns, which have produced their own dynamics and require separate treatment.
The CPHS shows the share of cereals in the total household food expenditures rising from an average of 10.4% in 2014 to 14.8% in 2017, before marginally falling to 14.1% in 2019 and then to 12.2% by March 2020. While the share of cereals as a proportion of total household food expenditures has gone up by around 2 percentage points during this time (2014 and 2020), there is a sharp decline observed in the share of processed cereals and pulses – atta, sooji, maida, poha, besan and other such flours and puffed/flattened rice products – from 12.6% to 5.6% during this same period. This runs contrary to the predictions of the 1997 CII-McKinsey report that projected a significant jump in household demand for branded ‘basic foods,’ including processed cereals and pulses. It is also worth noting that relative spending on cereal consumption has gone up even as the National Food Security Act (NFSA) of 2013, under which over two-thirds of the Indian population is entitled to receive at least 5 kg of wheat or rice per month at Rs 2 and Rs 3/kg, respectively, has been implemented.
As far as the other foods go, their percentage shares have been flat with occasional spikes (milk, vegetables & fruits, pulses, bread and biscuits and salty snacks/namkeens) or marginally increased (meat, egg & fish). On the whole, given the limitations of the CPHS data on consumption outlined at the outset and the analysis presented above, at best, we can infer that the shares of most foods in household expenditures have remained more or less constant since 2014. But this, again, is in value terms. The CPHS does not reveal if households are consuming more or less quantities of any food over time. The implications are different if a family spends a fixed sum of money on a particular food every month or consumes a fixed quantity of that food, irrespective of price and income movements.
Policy implications
India, during the first decade-and-a-half of this century, experienced a concurrent process of dietary and cropping diversification, mainly propelled by rising incomes. As household purchasing power across all income classes rose, there was an observable shift in the data on consumption patterns, with increasing demand for milk, eggs, chicken, vegetables, fruits and other such protein and micronutrients-rich foods. Farmers and agri-businesses, in turn, responded to the higher demand by ramping up supply. This was reflected in the production growth of dairy, poultry and horticulture sectors far outpacing that of regular cereal crop agriculture.
The limited data points available for the more recent period would make it seem that this largely market-driven process may have since stalled. Only an NSS HCE survey can really confirm that, underscoring yet again the urgent need for such data, especially given the very serious implications for human health and nutrition. When incomes don’t rise, household consumption of protein and micronutrient rich foods such as milk, pulses, fresh fruits and vegetables, meat and eggs, become unaffordable relative to those high in calories/carbohydrates such as rice, wheat and sugar.
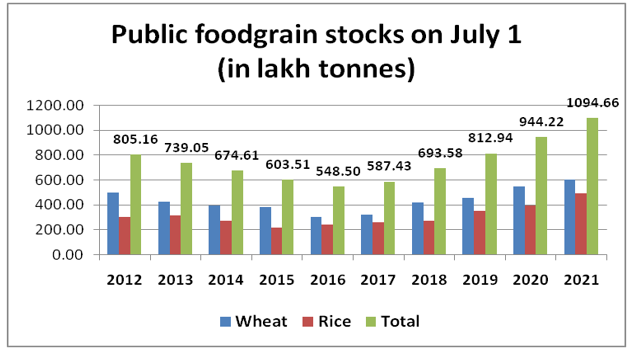
There are also serious implications for agricultural production and diversification. When farmers don’t see enough market demand for livestock, poultry and horticultural products, they are likely become more risk averse and go back to cultivating crops where minimum yields and price support are assured: paddy, wheat and sugarcane. Both wheat and rice stocks in the Central pool were at record highs of 60.36 mt and 49.11 mt as on July 1, 2021, and way above their respective minimum required levels of 27.58 mt and 13.54 mt for this date. The same goes with sugarcane, where delayed payments by mills haven’t stopped farmers from persisting with this sturdy crop that can withstand “ola (hail), pala (frost), aag (fire), paani (floods), nilgai (Asian antelope) and jangli suar (wild boar)” (https://bit.ly/3fY8cPf).
Source: Food Corporation of India.
The reality of the present demand situation, especially post-Covid, needs to be reckoned with. Official production estimates in milk, for instance, appear wholly out of sync with data on sales by organised cooperatives as well as private dairies. To reiterate an earlier point, only an NSS HCE survey can give a clear picture of consumption of various foods and make demand forecasts based on that. Such surveys should ideally be carried out every year, like the Period Labour Force Surveys from 2017-18, even if with smaller sample sizes. This is important both for crop and nutritional planning. Without data on what and how much Indians are consuming, how can there be any credible policymaking or projections for the future?
Secondly, the time has come to look at dietary and cropping diversification without assuming that this will simply and inevitably be ‘market-driven’ and sustained. It would mean redesigning policy currently biased towards production of crops that primarily meet energy needs, as against foods delivering more wholesome “nutritional security”. Moving from basic “food security” to “nutritional security” requires overhauling the governmental procurement and public distribution system. As a range of voices have been pointing out, this would require well-considered and supported transitional policies and systems to be put in place and should prioritise and reallocate resources (including Minimum Support Price-based procurement) towards pulses, millets, vegetables, milk and eggs. A centrally-funded decentralised system of procuring and distributing these foods, both through fair price shops as well as Integrated Child Development/Mid-Day Meals Scheme can play an effective role in combating endemic hunger and malnutrition.
Policy interventions of this kind, however, have their own considerable challenges and if built on the assumption that state policies like procurement alone can shape and sustain demand or production without a whole range of unpredictable effects, they are likely to cause other grave problems down the line. But new strategies and systems are urgently required, and these will need much deeper engagement and understanding of the dynamics of income, consumption, demand, dietary diversification, agricultural production and distribution.
This note, part of the Understanding the Rural Economy series by CPR, has been authored by Harish Damodaran, Mekhala Krishnamurthy and Samridhi Agarwal.
Find all previous notes as part of the series here:
Does the quality of healthcare providers that people use vary systematically by socioeconomic status in rural India? A new study by Jishnu Das, Senior Visiting Fellow at CPR, and Aakash Mohpal combines unique data (collected between 2009 and 2011) on the quality of providers and primary care visits among 23,275 households in rural Madhya Pradesh to examine this question. Their paper titled Socioeconomic Status and Quality of Care in Rural India: New Evidence from Provider and Household Surveys was published in a special issue of the journal Health Affairs.
Why is the research important?
Equitable health systems ensure that the poor and the rich receive the same quality of care. Assessing equity in healthcare and identifying disadvantaged populations is the first step towards improving health outcomes for those who need it most. Yet, the lack of data on who provides healthcare in rural India or how rural populations use such providers hampers a systematic approach to the question.
What does the research do?
For 100 villages in rural Madhya Pradesh, Das and Mohpal (a) provide the first ‘counts’ of the availability of healthcare providers and their qualifications; (b) measure the quality of available care using specially developed tests of medical knowledge known as ‘medical vignettes’ and; (c) survey all 23,275 households and link household characteristics to the quality of providers they visited.
These unique data allow the researchers to understand the nature of the disadvantage in rural India as it relates to the use of healthcare. It answers the key questions:
How many health care providers can a rural household access in this region and what are their qualifications?
What types of health care providers provide the bulk of primary care in rural Madhya Pradesh?
How does quality of care vary by household’s socioeconomic status?
How was the research conducted?
The study was completed in three phases:
In the first phase, Das and Mohpal visited all villages and convened focus groups to identify all providers that households accessed for primary care. These providers included both those who were in the village as well as those who were in markets close to the village–typically on the main road or highway nearby. For all providers who we identified, they completed a short questionnaire that included information on their demographic, practice and clinic characteristics.
In the second phase, they surveyed all 23,275 households and asked about morbidity in the household. For those who had fallen sick in the last month, they asked if they visited a provider and which provider they visited. Das and Mohpal recorded 19,331 primary care visits in the last month and were able to match household characteristics to provider characteristics for 18,850 primary care visits (98%).
In the third phase, they returned to a large sample of healthcare providers and administered medical vignettes to assess their knowledge. Using their performance on this test as a measure of quality, they examined the link between village and/or household socioeconomic status (SES) and the quality of care that people receive.
What were the key findings?
The average village in their sample could access 11 healthcare providers and 49 percent of these providers had no formal medical training. Usage data were even more striking: 77 percent of all primary care visits were to providers without any formal medical training. Only 11 percent of all primary care visits were to the public sector and only 4 percent were to providers with an MBBS degree.
Providers of average quality in the selected sample were able to correctly diagnose 5 key conditions 47.3% of the time and correctly treat these conditions 68% of the time. Because in some cases correct treatment could include ‘referrals to a higher level’, conditions could be correctly treated without a correct diagnosis. Providers with an MBBS degree had higher correct diagnosis and correct treatment rates, relative to those with alternate qualifications (AYUSH) and those without any medical training.
When it came to equity, there was a key difference between the `village’ and the ‘household’ as the unit of analysis. Low SES (socio-economic status) households living in low SES villages use low quality care. But low SES households living in high SES villages use higher quality care. In fact, when Das and Mohpal compared low and high SES households living in the same village, they found no difference in the quality of care received. These findings show that where people live matters more than who they are.
There is striking evidence in this population–the majority of which is poor and illiterate–that households can assess the quality of health care providers and actively seek out higher quality. When patients travel farther, they access higher quality care. And low SES households travel farther than high SES households to access the same quality care.
Interpreting the findings:
Despite significant increases in budgetary allocations through the National Rural Health Mission, the vast majority of households surveyed between 2009 and 2011 still relied on private sector providers without formal medical training for their primary care needs. However, two features of the rural landscape and household behavior in this region limit health inequity in the system.
First, villages in this region are ‘integrated’ rather than ‘enclaved’. That is, instead of a situation where most high SES households live in high SES villages and low SES households live in low SES villages, the researchers found that a significant fraction of low SES households live in high SES villages. This means that they have access to higher quality providers, either in the village, or close to the village.
Second, low and high SES households living in the same village visit providers of similar quality. This is not because they visit the same providers, but because low SES households are willing to travel farther to access higher quality. And by doing so, they can reach more competitive markets where prices are lower.
Consequently, most of the inequity in this system arises from disparities between larger, higher SES villages that are also well connected and small, low SES villages that are scattered, far from roads and can access only low quality providers. In some of these villages, even walking 2 hours will not bring the patient to a higher quality provider.
Way forward:
At the outset, Das and Mohpal note that providing public care in scattered rural outposts is a very costly option. Even if the government were to staff these posts, the number of patients would be so low that doctors may effectively provide care to only 5-6 patients a day. Options that are worth pursuing include (a) training informal sector providers who practice in every village, and (b) providing some kind of medical transport that allows households from rural and scattered villages to visit providers in larger towns and cities.