|
Author: cprindia

 Ecosystems of Engagement: Digital Platforms and Women’s Work in Sri Lanka and India

 What Matters for Urban Women’s Work: A Deep Dive Into Falling Female Labour Force Participation


 Housing, Spatial-Mobility and Paid Domestic Work in Millennial Delhi: Narratives of Women Domestic Workers

How can India Create More Jobs? Unleashing the 1.4 billion: A Blueprint for India’s Job-Led Growth
India stands at a historic threshold. As the world’s youngest nation with a median age of just under 29 years, it possesses a demographic engine that could power global growth for decades. Yet, as the country approaches the centenary of our independence, it confronts the “2047 Paradox”: a “Great Decoupling” where soaring GDP growth is no longer translating into enough secure livelihoods. To achieve the vision of Viksit Bharat, India must create 10 to 12 million new jobs every year by releasing the “Structural Brakes” that currently hold our workforce hostage and move beyond the myth that only industrial giants can save us.
The Diagnosis: Beyond the Industrial Myth
For decades, policy has focused on “Firm-Chasing” i.e., attracting large, mature industrial giants. Mature firms, particularly those older than a decade, are no longer the job creators. They exhibit a creation rate of negative 3.5% and have become net job destroyers, while firms less than five years old, the “Ojazelles”, are responsible for 45% of all new jobs in the nation. The failure to scale these young firms is the outcome of two deep structural features, viz., the Collateral Trap and Regulatory Dwarfism.
Collateral Trap refers to the bias of the Indian credit system towards ownership of ancestral land. This “credit apartheid” subsidizes stagnant legacy firms, while starving the dreamers. To achieve Viksit Bharat 2047, India must move toward a financial architecture where information replaces land as the primary currency of trust. If we fail to act, the landless will remain cut off from credit, sidelining millions of potential job creators and turning India’s demographic dividend into a missed opportunity.
Regulatory Dwarfism describes the current situation, where 98% of Indian manufacturing firms employ fewer than five workers. They stay small not because they lack ambition, but to stay below the “regulatory ceiling” of complex compliance and rigid labour laws. As a firm scales, it encounters a “regulatory tax” that increases not linearly, but exponentially. When a firm crosses the 50-employee mark, many states trigger the Apprentices Act and health safety mandates. For an entrepreneur, hiring the 51st worker can quadruple the “governance tax” on their time and capital, making it more profitable to remain a “dwarf” than to become “small.”
The Blueprint: A New Social Compact
To achieve a $30 trillion economy, we must shift the State from a regulator that “controls” to a partner that “trusts.”, a Phoenix Mandate that radically re-engineers of our economic DNA. This mandate comprises of four specific changes, viz.:
- Information-Based Lending (IBL): India should move from asset based collateral to information based lending by leveraging its Digital Public Infrastructure. The emphasis should be on credit through high frequency data traits generated by Aadhaar, UPI and GSTN which can enable credit through cash flow history, utility bill records and GST invoice velocity, instead of land deeds. This shift can unlock the credit for young entrepreneurs in semi or informal sectors of the economy, while lowering costs and accelerating formalisation.
- The Mobility Shield: In a highly mobile labour market, welfare benefits should be accessible to all. A worker from Bihar should access food, health and insurance entitlements in Tamil Nadu as seamlessly as in their home village. An Aadhaar linked ‘Digital Benefits Account’ and implementation of ‘One Nation, One Ration Card’ can ensure that there is no geographical constraint on the benefits for an individual.
- Dismantling the “Paper Ceiling”: Industry reports suggest that a significant portion of Indian graduates are unemployable in high value roles. To achieve Viksit Bharat, India should de-stigmatize vocational training and legitimize micro certificates. By developing an AI literate and skill first workforce, India can generate highly productive human capital with future-fit skills. The Green Transition alone could create 35 million jobs in EV architecture, green hydrogen, and circular waste – but only if we de-stigmatize vocational mastery.
- The Gender Dividend: Finally, we must stop treating the gender gap as a social issue and start treating it as a macroeconomic emergency. In India, female employment is hindered by safety, cost of mobility and a disproportionate burden of unpaid care work. Formalizing the Care Economy is the key to unlocking the productivity of half our population.
The Call to Action
The choice before us is clear: To achieve Viksit Bharat, India should stop pouring fiscal resources to legacy industries and start providing the liquidity required for Green Digital and AI Driven industries. The transition from land based collateral to information based collateral can empower the youth of this nation. India needs a National Jobs Council, modeled after the GST Council, to align the Center and States in a mission to dissolve the “Missing Middle”, and nurture more “Ojazelles”. The path to 2047 does not belong to the monopolies of the past; it belongs to the 1.4 billion. It is time for the Indian Phoenix to fly.
TREADS Dialogues I — The Institutional Question: Water Security for Viksit Bharat
India’s water crisis persists not due to lack of policies or resources, but due to institutional fragmentation, short-termism, and the absence of coordination. Without institutional convergence at the national level, water security goals for Viksit Bharat 2047 will continue to be undermined.
Water risk governance lies at the core of India’s water security challenge
The Dialogue acknowledged and agreed that water security is inadequately framed in Indian policy discourse. It neglects water-related risks, particularly floods, droughts, and water quality degradation. Climate change intensifies these risks, making risk management a core governance challenge. The current discourse focuses heavily on “provision and access” (e.g. Jal Jeevan Mission) while neglecting the costs of risks. The forum noted that recent floods in Punjab, Uttarakhand, and Himachal Pradesh wiped out significant economic value for those specific states, underscoring the high cost of risks.
The abandoned effort to draft the National Water Policy (NWP) is a missed opportunity
The abandoned effort to draft NWP (2020) is a missed opportunity to address emerging governance challenges, both for water resources development and in coping with risks. It also could have addressed the most crucial element missing in the earlier efforts of national water policymaking – to articulate institutional pathways and mandates for translating and implementing policies, especially given the crucial challenge of Centre-State coordination.
Interstate nature of river water governance
Although nearly all Indian river basins are interstate, water governance continues to operate assuming water is exclusively a State subject. This operational practice deviates from constitutional intent and undermines the Centre’s role and responsibility in addressing extraterritorial and trans-jurisdictional water risks. Over successive planning periods, the Centre has progressively withdrawn from direct investment and asset ownership in water infrastructure. States now dominate capital expenditure and project control, leaving the Centre with limited influence, confined largely to dispute resolution and advisory roles.
Interstate water dispute mechanisms focus exclusively on allocation shares, treating water as divisible property rather than a resource requiring efficient deployment. Excessive reliance on laws and a lack of investment in institutions have been a bane in interstate coordination. India’s interstate bodies and commissions remain project-driven, politically contingent, and very often bilateral rather than institutionalised. The River Boards Act, 1956 has never been operationalised, and existing institutions lack the legal authority to enforce holistic planning or sustain long-term cooperation.
Fragmentation across Union Ministries is a structural barrier
Water-related functions are dispersed across multiple union ministries — Jal Shakti (MoJS), Power (MoP), Agriculture (MoA&FW), Ports & Shipping (MoPSW), without an effective coordination mechanism. This fragmentation prevents integrated basin-level decision-making and creates institutional dissonance, especially in multi-purpose projects concerning storage, hydropower, navigation, and flood management. For instance, in basins such as the Brahmaputra, original storage-oriented flood and water management projects have been converted into run-of-the-river hydropower projects due to sectoral dominance by power institutions. This shift fundamentally alters basin outcomes and sidelines water security objectives in favour of revenue generation.
Sub-national water governance is trapped in short-termism
State-level water decision-making is shaped by short political and fiscal cycles. Long-gestation water projects are pursued without adequate assessment of debt sustainability, long-term efficiency, or future intergenerational impacts. The focus remains on building new infrastructure rather than optimising existing allocation. Besides, the subnational water resources institutions have deeply entrenched cultures driven by supply augmentation with limited or institutional internationalisation of demand management.
Absence of an effective apex coordinating mechanism is a core governance gap
While bodies such as the National Water Resources Council (NWRC) exist, they are dormant and ineffective. The Dialogue identifies the absence of a technocratic–bureaucratic apex coordination mechanism as the single most critical institutional gap preventing convergence across ministries, sectors, and time horizons.
India’s water storage capacity remains structurally inadequate and institutionally undervalued
Some experts argued that with India having only ~300 BCM of storage against a potential of 450 BCM, creating more storage is essential to buffer against the changing water cycles caused by climate change. Despite being a monsoon-dependent country with high flood and drought variability, India has failed to build and protect adequate strategic water storage, particularly in water-surplus basins such as the Northeast; storage-oriented projects have been repeatedly diluted or converted into run-of-the-river hydropower projects due to sectoral and institutional fragmentation, leaving the country unable to mitigate climate risk, regulate flows, or secure long-term water availability.
CPR Insights | The Possible Fiscal Impact of VB G RAM G on States
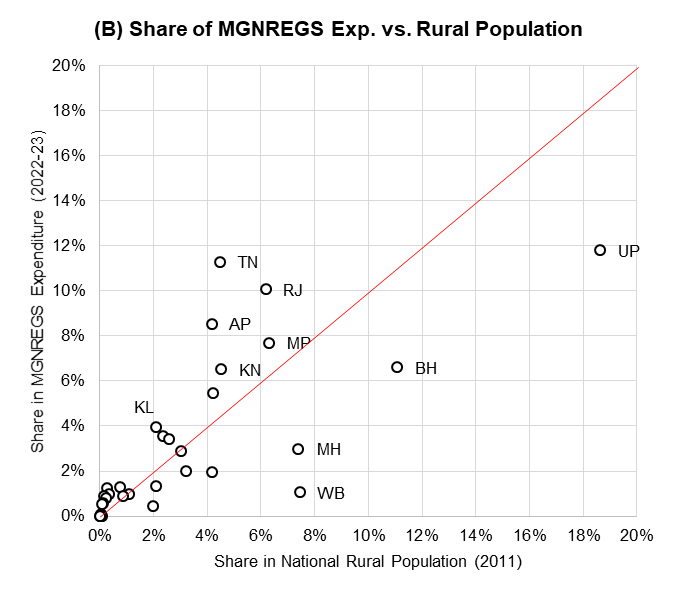
Figure 1: Impact of Making States Pay for MGNREGS Expenditure

Source: For MGREGS https://mnregaweb4.nic.in/netnrega/Citizen_html/financialstatement.aspx?lflag=eng&fin_year=2022-2023&source=national&labels=labels&Digest=kODLAkQv8M9FT6WbXb7zhA and RBI State Finances https://rbi.org.in/Scripts/AnnualPublications.aspx?head=State%20Finances%20:%20A%20Study%20of%20Budgets and Census 2011
One of the differences between MGNREGS and VB G RAM G is that the states will now need to pay a portion of the VB G RAM G bill.[1] How will this affect the states’ fiscal condition? To answer this question, we look at data from 2022-23, the year for which final accounts are available across states from the RBI and also the year for which actual state-wise expenditure is available for MGNREGS. We calculate two metrics, viz. 40% of the share of expenditure on MGNREGS in a state divided by the state’s developmental expenditure and the state’s total own revenue (its own taxes and share in central taxes), i.e., an expenditure-based metric and a revenue-based metric.
The grey and black bars in Figure 1(A) show that this number can vary considerably across states, from less than 0.5% to more than 5%. For about half the states using both the revenue metric (16) and expenditure metric (15), this share would have been below 2% in 2022-23. All five states where both metrics are more than 3% are in the Northeast, viz. Nagaland, Meghalaya, Manipur, Tripura, and Mizoram (Jammu and Kashmir is the sixth state by the revenue metric). But how are we to judge these metrics – how burdensome is it to re-allocate 3% of revenue or spend an extra 3% of developmental expenditure? For this, we compare it to the amount of rural development expenditure being undertaken by the states. Table 1 groups the states into four – those with high and low shares of MGNREGS spending to total revenue, vis-à-vis high and low shares of rural development spending to total revenue. In some states like Kerala, Tamil Nadu, and Rajasthan in the upper left quadrant, the share of MGNREGS expenditure compared to their share of the rural population is also high, as in Figure 1(B).
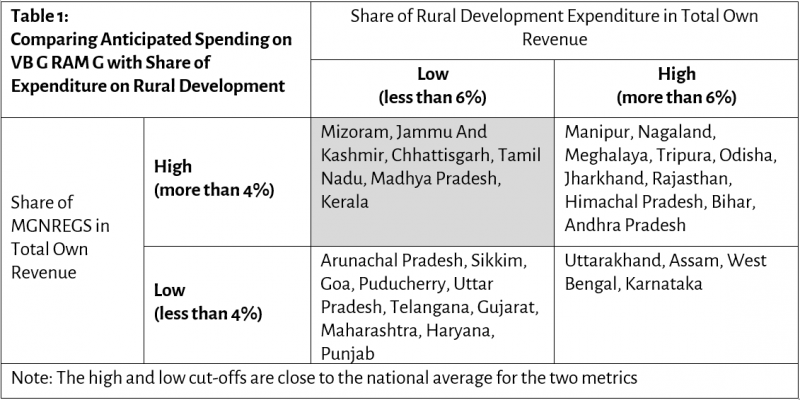
Among major states where the anticipated (40%) share of MGNREGS in total revenue is high, the increase in expenditure in Kerala due to the anticipated state share of MGNREGS would be a massive 80% of the amount that is currently spent on rural development (which is often a fraction of what is budgeted in the state). In Tamil Nadu (54%) and Madhya Pradesh (47%), the increase in expenditure due to the state share of MGNREGS would be half as much as is spent on rural development, in Chhattisgarh (37%) and Andhra Pradesh (31%), it would be about a third as much. And finally, in states like Rajasthan (26%), Himachal Pradesh (26%), Odisha (22%), Bihar (20%) and Jharkhand (19%), it is about a fifth to a quarter, since these states already spend a high proportion of revenue on rural development. These numbers indicate that the impact could be substantial, especially without a phase-in period.
______________________________________
[1] One of the more pointed criticisms of the shift from MGNREGS to VB G RAM G is that it is like “providing a work guarantee without any guarantee that the guarantee is in place” as pointed out by Jean Dreze, referring to the “switch off clause”. See https://indianexpress.com/article/india/jean-dreze-vb-g-ram-g-bill-providing-work-guarantee-place-10425760/). This post does not address these or other critiques of the shift.
Dhampur: A Small Town Shaping into a Regional Educational Hub
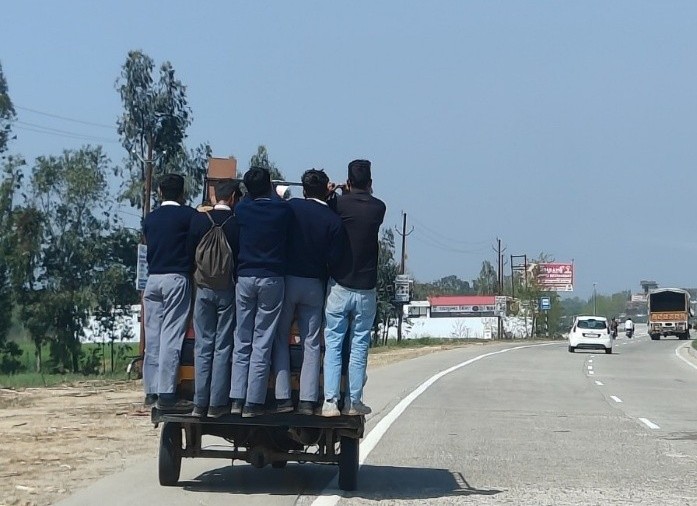
Education is a quiet sunrise that empowers human potential, and even a small town like Dhampur can play a major role in shaping the educational landscape of the town and its hinterland. In 2024, during field visits for our longitudinal research study titled “Forty Years’ Development Saga of Dhampur: Growth Dynamics and Regional Transformation Potential of an Indian Small Town,” we observed numerous schools and colleges spread out across the town and on its periphery. The mornings in the town begin with the steady flow of school buses, e-rickshaws and autos carrying children, and some students also riding their own bicycles to school. It was indeed surprising for us to see such a large number of schools and colleges for a small town like Dhampur with about 1 lakh population located in district Bijnor, Uttar Pradesh. The very first question that came to our mind was, do these schools and colleges serve only the students from the town, or do they also cater to the students from surrounding towns and villages?
Narendra Gupta, an industrialist and a prominent citizen of Dhampur, who has seen the educational transformation of the town, mentioned that the quality of education was very poor in Dhampur in the early days of his education, before independence. Therefore, he used to travel daily by an early morning train at 3:20 am to attend his intermediate college in Nagina town located about 26 kilometres away. At present, the educational situation has changed completely. Most of the students don’t even need to go to other nearby towns for their early education. Now, only a small number of students from influential and affluent families, such as industrialists, doctors, and big traders, pursue their higher education in prestigious institutions across India and abroad, particularly in countries like the UK and the USA. As incomes rise and aspirations increase, these families prefer prestigious national and international universities that they perceive as offering higher-quality education, broader exposure, and superior career opportunities.
Yashpal Tuli, a retired professor of RSM Inter College and another prominent citizen of the town, informed us that in 1947 there was a primary school commonly known as the Free School Dhampur, where even the rich kids used to study. In addition, there were three inter colleges set up in 1943, two co-ed colleges, namely the RSM Inter College and KM Inter College, as well as a Kanya Inter College, where parents could send their daughters to study without any concerns or hesitation.
Both the prominent citizens mentioned that educational institutions in Dhampur are comparatively more affordable and offer facilities of a national standard. They also stated that Dhampur’s school and colleges are not just serving the surrounding villages but also the nearby towns such as Sherkot, Nagina, Nehtaur and Afzalgarh. Their views align with our field observations that Dhampur also serves the students of neighbouring districts. During our fieldwork, we came across some well-dressed students in school/college uniform at the railway station of Dhampur who commute daily from Moradabad to Dhampur to pursue higher education, particularly BSc in agriculture. According to these students, although Moradabad has larger and better colleges, they commute about 100 kilometres daily as higher education in Dhampur is comparatively more affordable, making it a preferred choice for many economically conscious students.
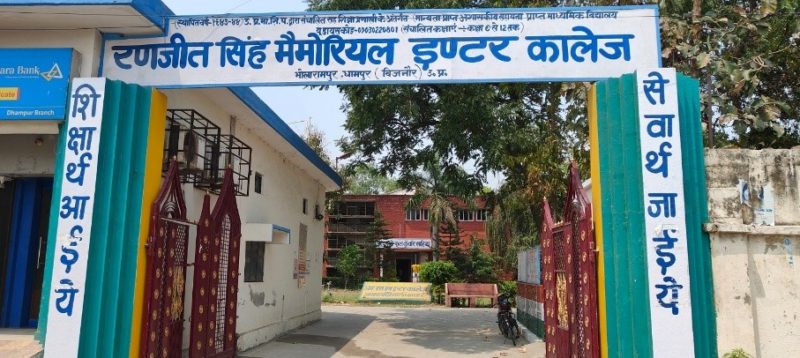
The aristocratic and industrialist families have played an important role in empowering the educational potential of Dhampur. It began with the vision of Rani Phool Kunwari Sahiba, who in 1943 laid the foundation by establishing the Ranjeet Singh Memorial (RSM) Inter College as a heartfelt tribute to her husband, late Kunwar Ranjeet Singh. The inter college began as a school and progressed to become RSM Degree College in 1958. It offers education at both undergraduate and postgraduate level. At present, RSM Degree College serves approximately 3700 students from Dhampur and nearby villages. In memory of Rani Phool Kunwari Sahiba, the family later established the Rani Phool Kumari Memorial School in 1974, which is currently managed by her daughter-in-law, Bhaktiji.
Another influential figure Seth Kirori Mal established the K. M. Inter College in 1943. Industrialist Narendra Gupta has also contributed greatly to the town’s educational development. He founded three institutions: Premwati Devi Memorial Mahila Mahavidyalaya (2009), Premwati Devi Memorial Convent School (2012), and Usha Memorial School. He is also involved in the management of Shikhar Shishu Sadan School and Dhampur Mahila Shiksha Sabha Sadan. The founding Goel family of Dhampur Sugar Mill has further supported local education by establishing one of the town’s leading schools, Pushp Niketan School, in 2005.
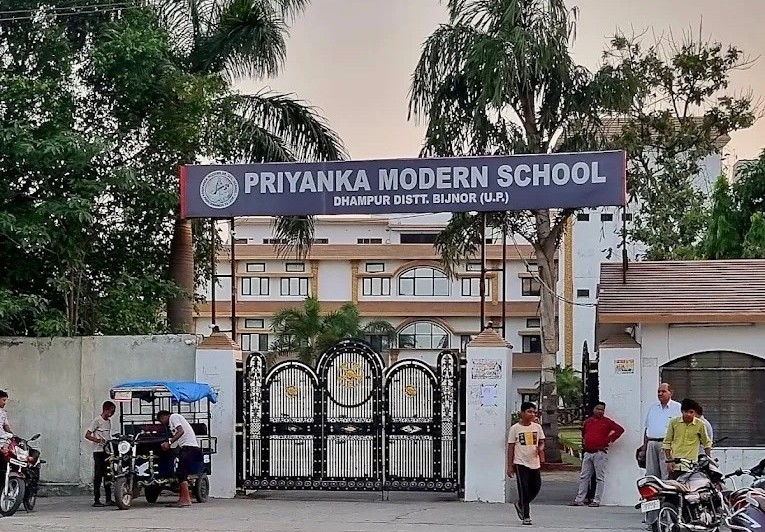
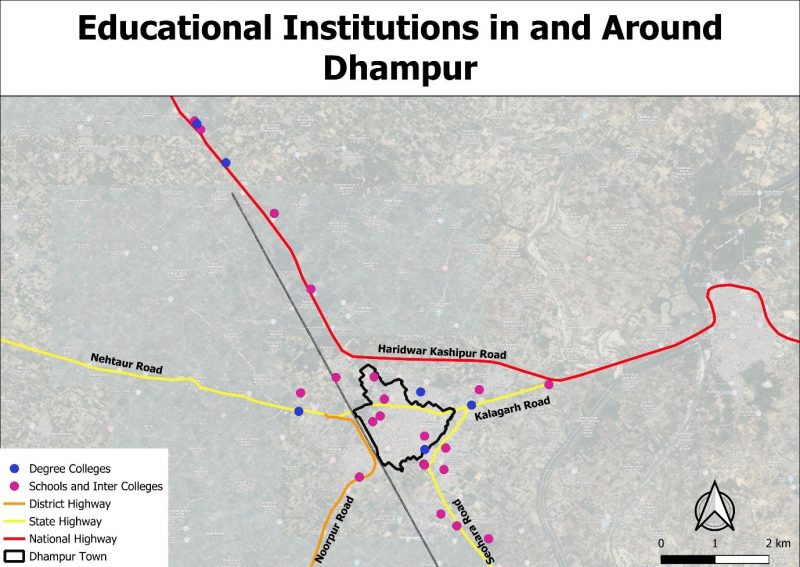
At present, there are around 30 schools and colleges in and around Dhampur. Some of the prominent colleges and schools are RSM Degree College, KM College, Disha Group of Institutions, Dhampur Institute of Technology, Holy Angel Academy Dhampur, Kanya Inter College, Pushp Niketan School, Priyanka Modern School, St.Mary’s Convent Senior Secondary School, Durga Public Senior Secondary School, etc. Colleges offer graduation, post-graduation and PhD courses in social sciences, sciences, technical fields, agriculture, nursing, and law etc. Many of the new schools and colleges have come up in the town’s outskirts along the four highways due to availability of large parcels of land required to establish these institutions. From being a social service supported by the philanthropic elite of the region in the early 20th century, education has emerged as the sunrise service sector considered as a profitable venture by private investors even in a small town like Dhampur.
The presence of such a large number of educational institutions has certainly helped in reaching a higher literacy rate in Dhampur. According to the Census of India 2011, the literacy rate of Uttar Pradesh was about 68 percent, while Dhampur tehsil performed better with a literacy rate of 71 percent in the same year.
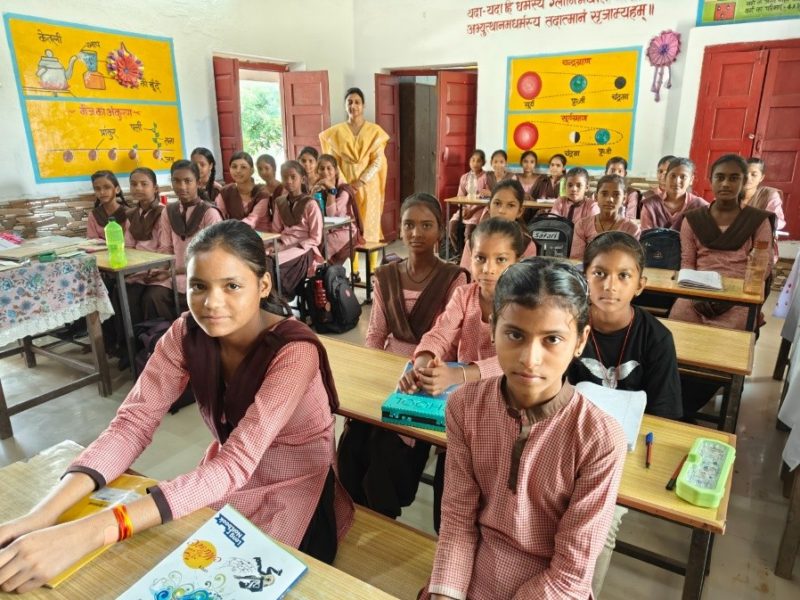
Census 2011 also shows that about 43 percent of the population of Bijnor district is Muslim, which is considerably higher than the national average of about 14 per cent for the same year. Therefore, we considered it important to explore how inclusive the education in Dhampur is along religious and gender lines. We asked this question in three sample schools. There are about 3,500 students in RSM Inter College and about 1,000 students in Durga Public Senior Secondary School. Of the total students enrolled in these two institutions, 67 percent are Hindu and 33 per cent are Muslim. Around 70 percent of the students are boys, and 30 per cent are girls. Whereas in Shikhar Shishu Sadan School the Hindu-Muslim break-up of the students is equal at about 50 per cent. However, these results may have a sample bias as more girls may be going to exclusive girls’ schools. Also, lower muslim students’ enrollment may possibly be because many students may be attending religious schools or Madrasas located in the core city.
The direct impact of good educational facilities in Dhampur can also be seen on the sample nearby villages, too, especially Aladinpur Bhogi where 40 per cent of both men and women have studied in Dhampur or are currently studying there. About 24 per cent study within the village, and the remaining 36 per cent study in nearby villages and towns like Puraini and Nagina, which are around 9 and 14 km away from Aladinpur Bhogi. In Sarakthal Madho, the situation is different where only 19 per cent of both men and women study or have studied in Dhampur. Around 15 per cent study within the village, while 66 percent go to nearby villages, namely Umri and Morna, located at 3.5 km and 4.5 km distance respectively, which have several good educational institutions such as Indra Devi Memorial Girls Degree College and Devta Inter College, along with multiple private schools. This is understandable considering that Dhampur is around 10 km away from Sarakthal Madho. Villagers said that good schools and colleges are now available in these closer areas, so they prefer sending their children there instead of Dhampur. Only a small number of fourteen students from both villages have gone out of the state to study. These students, mostly from prominent families and large farming households, are studying in cities like Delhi, Dehradun, Ghaziabad, Garhwal, Roorkee, and Noida.
The education levels have generally improved across Uttar Pradesh over the past four decades, largely as more schools and colleges have been established and also because of the active state promotion for increasing school enrolment. Results from our longitudinal study, conform to this trend of increased school attendance in the two sample villages. In 1979-80, about 48 per cent of both males and females below the age of 21 years of Aladinpur Bhogi and 50 per cent of male and female below the age of 21 years of Sarakthal Madho were going to school at that period of time. In 2024, in Aladinpur Bhogi 97 per cent males and 81 per cent females below the age of 21 were going to school. In Sarakthal Madho, 90 per cent of both males and females below the age of 21 years were going to school.
The government has also played a major role in improving education in the state by creating more infrastructure. As per Purna Borah, Chief Development Officer, District Bijnor, informed us that library facilities have been created in 45 of about 1000 government schools and they plan to cover all the schools in due course. They are also planning to set up scientific labs in these schools. Bijnor stands in the top 5 of National Initiative for Proficiency in Reading with Understanding and Numeracy (NIPUN) Bharat Mission Districts. NIPUN Mission launched in July 2021 by India’s Ministry of Education, is a national mission to ensure all children achieve Foundational Literacy and Numeracy (FLN) by the end of Grade 3 by 2026-27. It focuses on improving skills in reading with understanding, writing, and basic numeracy for every child through initiatives like teacher training and developing resources.
In the past 7-8 decades, from students going to other towns for their education to students coming from other towns and villages to Dhampur for their education shows how Dhampur has grown as an important institutional hub offering affordable and accessible education that benefits nearby villages and other towns, improving student enrolment, opportunities, and overall literacy over time. The establishment of schools and colleges as a charitable act by the affluent aristocratic and business families, and subsequently supported by the private sector is the main drive behind a small town like Dhampur becoming an important educational hub in the region.
Land Rights Initiative turns 11!
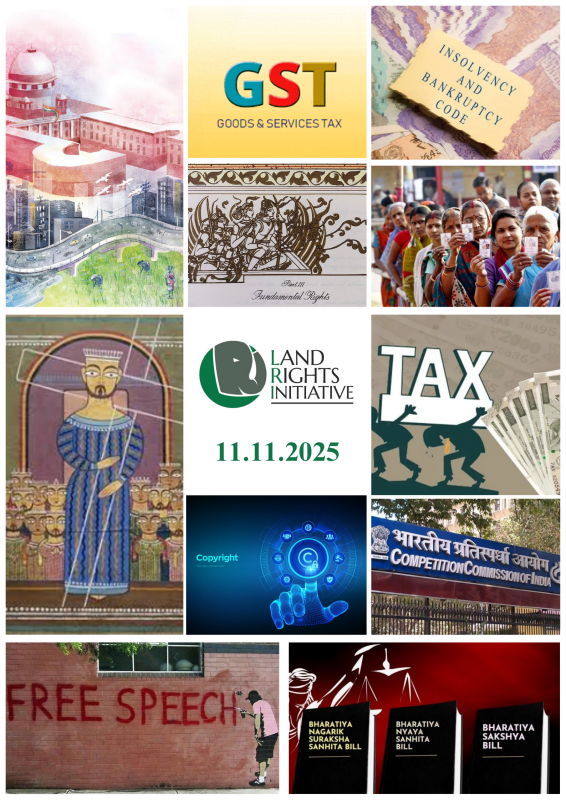
Founded on 11/11/2014 at Harvard Law School, and incubated at the Centre for Policy Research, LRI turns 11 today! The world today is remarkably different than at the time of LRI’s founding. Climate devastation, wars, internal armed conflict, and growing political and social polarisation have created unprecedented pressure on existing policy imaginaries relating to land, water, and forests, and indeed on the social contract between state and citizens envisaged in our Constitution. These changed circumstances have led us to reimagine the work of the Land Rights Initiative as it enters its second decade.
Last year, to mark their milestone 10th anniversary, LRI launched a year-long series of talks on “Legal History”. Celebrating LRI’s pioneering achievements in bringing land rights to the focus of academic and policy work in India, this series featured talks by twelve legal scholars, practitioners, and historians. The speakers lectured on a diverse range of subjects using a “legal historical” approach, one of the methodological approaches used by LRI in its work over the past decade. The goal of this series was also to take stock of all the changes in the legal landscape over the past decade across areas of law as diverse as property, taxation, free speech, criminal laws, artificial intelligence and copyright, electoral laws, competition and bankruptcy law, and to examine the intersections of these laws with LRI’s work over the past decade. Given the immense popularity of the series, LRI will be launching the next year long instalment of the Legal History Series soon.
This year, LRI will also be launching a new research project in the area of Climate Justice. Recognising that the atmosphere is an “ecological commons”, climate justice demands that these commons not be enclosed by a handful of polluters. Climate justice also demands that people be compensated for the impact of climate chaos caused by the actions of others. But above all, climate justice demands that every person, community, and society have the freedom to create economies that cause no harm to the climate or to other people. The climate justice movement builds on grassroots traditions often led by marginalised groups resisting legacies of colonialism and focuses on climate debt as a key organising arena. The climate justice movement is intersectional, understanding that intersecting social identities shape how people experience privilege and oppression.
India’s strategy for combating climate devastation as outlined in the government’s “National Climate Mission”, and in its “Nationally Determined Contributions” under the Paris Agreement have eight pillars. One of the pillars is afforestation and combating deforestation. India is a pioneer in the adoption of the Forest Rights Act, 2006, which recognises both individual and community rights to the forest of Scheduled Tribes or indigenous groups and other traditional forest dwellers. The Forest Rights Act encapsulates two important aspects of indigenous imagination. The first is that humans are not separate from the environment, and therefore no afforestation policy is workable without the active engagement of the communities that have been living in forests as their way of life for centuries. The second is that “jal, jungle, zameen” (“water, forest, and land”) are part of one indivisible ecosystem which is not just crucial to the Adivasi or indigenous way of life but for climate sustainability on planet earth. India has no legal framework to address climate concerns of other ecologically vulnerable communities like fisherfolk, pastoral and other nomadic communities.
LRI’s Climate Justice project will have four focus areas. First, ensuring effective implementation of existing domestic law like the Forest Rights Act in order to preserve and regenerate India’s forest cover. Second, aligning national laws pertaining to land, water, and forests to help government and the people better respond to climate threats. LRI has already done preliminary work in this area with their “Mapping Indian Land Laws” project, which is now available both in its web and mobile versions on landlawsofindia.org. This is India’s first ever interactive, exploratory archive of over five hundred colonial and post-colonial land, water and forest laws, a veritable “google maps for land laws”. Third, realigning international law frameworks currently operating in silos, including the following treaties, the UN Framework Convention on Climate Change, the UN Convention to Combat Desertification and the United Nations Convention on Biological Diversity. Fourth, enabling alignment of India’s national laws on land, water, and forests, with the international legal framework described above, and in the process ensuring climate justice for all.
As always, we remain incredibly grateful to the Centre for Policy Research, the Centre on Law and Social Transformation at the University of Bergen, Harvard Law School, and our researchers, donors, mentors, collaborators, government, civil society groups, and communities that have made this journey possible and our work sustainable.
Dr. Namita Wahi,
Founding Director, Land Rights Initiative,
Senior Fellow, Centre for Policy Research
Flooding Disrupts Life in Dhampur and Surrounding Villages Once More: Why do we Fail in Flood Mitigation?
The monsoon rains bring a respite from the scorching summer heat and promise of a good harvest, but it also brings perils of inundation that disrupt life and livelihoods. This monsoon season, 47 people have reportedly died in Bijnor district due to flooding. In addition, it was estimated that 4548 hectares of land were affected in 200 villages in the Tehsils Sadar Bijnor, Najibabad, Chandpur Tehsil and Dhampur, and the Pauri-Meerut National highway and the Bijnor-Hastinapur State highway were submerged under floodwater. Farmers are deeply dismayed at the massive loss of crops such as sugarcane and paddy. According to the Cane Officer of Dhampur Sugar Mill, 20 per cent (9,200 hectares) of the total area of the Mill’s supply zone was affected, which caused a loss of around 55 thousand quintals of sugarcane.
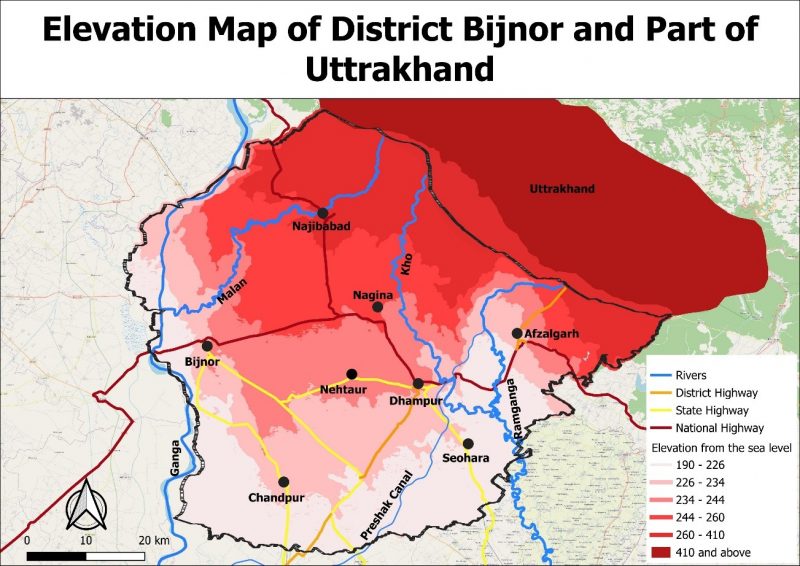
Bijnor lies at the foothills of Uttarakhand. The elevation of Bijnor district ranges from 190m from the sea level in the South to 410m in the Northern part of the district bordering Uttarakhand (Map 1). From there it rises dramatically to much higher elevations in the North and East falling in the Himalayan region of Uttarakhand. Rivers Ganga and Ramganga originate in Uttarakhand and flow through the district, along with their tributaries namely Malan and Kho. Ramganga merges with river Ganga in Kannauj district, Uttar Pradesh.
As per India Meteorological Department, the actual rainfall recorded for June to September 2025 was 1308.3mm while the normal rainfall for the same period is 904.5mm. In the last two and half decades, Bijnor has experienced floods every year in different parts of the district in various river basins, especially whenever the rainfall has crossed 1000mm. Heavy rains in the hills also discharge large volumes of water rushing into the plains of Bijnor causing flooding even when the local rainfall is not very high.
In the month of August 2025, Dhampur also experienced floods in the wake of heavy monsoon rains. The water level in the Kho River rose beyond its danger point, breached its embankments, overflowed onto the agricultural plains, and reached Dhampur town through culverts of the Haridwar-Kashipur highway and then through Ikkra Nala. Since the Nala is directly connected to many parts of Dhampur through the network of drains, it overflowed and inundated several parts of the town. The frequent flooding in Dhampur is also due to the blockages in the Ikkra Nala and drains caused by the indiscriminate dumping of plastics, kullhars, and other non-decomposable waste, reflecting both peoples’ irresponsible behaviour and inadequate waste management practices followed by the local government.
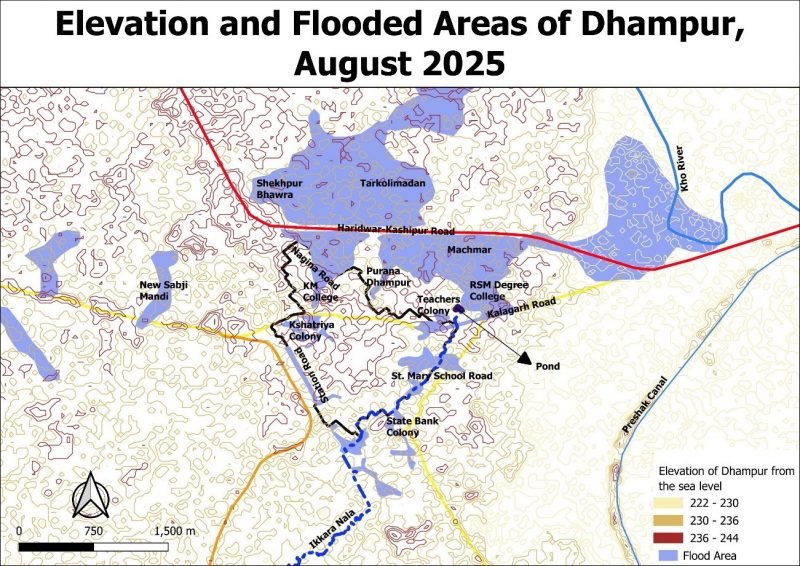
River Kho, a tributary of Ramganga River passes at a distance of less than 2km to Dhampur town. Ikkra River commonly called Ikkra Nala (see Map 2) originates from a pond in the North of the town and merges into Preshak Canal at a distance of 5 km East to Dhampur. Day by day the width of Ikkra River is reducing and shaping it more into a Nala form because of illegal encroachments on both sides. As a result, flooding in the upstream river system causes flooding in Ikkra Nala affecting Dhampur town and the surrounding rural areas.
Over a century ago, the core part of Dhampur town was sensibly built on relatively higher ground at an elevation of 236-244 meters from the sea level. But with the increasing population of the town, the municipal area expanded outwards which lay slightly at a lower elevation of 230-236 meters. As a result, low lying colonies located at the periphery of Dhampur town got flooded, which are: Station Road and Kshatriya colony in the west; KM College area in the North-West: area around Nagina Road and Puran Dhampur in the North; area around RSM Degree College and Kalagarh Road and Teachers Colony in the North-East; State Bank Colony in the South-East of the town: and St. Mary School Road in the East of the town. In addition, some of the surrounding rural areas were also flooded, which included the New Sabzi Mandi located on Nehtaur Road in the West of the town and parts of Shekhpur Bhawara and Tarkolimadan villages in the North (Map 2).
The flood in Dhampur town severely affected the daily life of the people. Houses, hospitals, schools, colleges, warehouses and showrooms were left with three to four feet of water in their basements. Furniture, electronic goods, vehicles and other belongings of the families living in lower elevation areas were damaged. Traders in New Sabji Mandi retrieved some of their goods to sell on carts on the highway. But they incurred huge losses due to the decaying of much of their stocks. The flood affected citizens also had to deal with the after effects of the flood for a much longer time including water logging, dampness in the walls with foul smell, and water collected in small pools that have become breeding grounds of mosquitos. To mitigate the hardships caused by the flood, the Dhampur Nagar Palika Parishad (NPP) took several adaptive measures to support the affected people. They asked the citizens residing in shabby buildings to move to temporary shelter homes. The Parishad also provided food to those flooded households that were not able to cook their meals.
Although the Indian Meteorological Department gives an early flood warning, the mitigation measures adopted by the Irrigation Department are inadequate. The government has been spending crores on strengthening the embankments of the rivers with stones, wood and sandbags to curb erosion of river banks and manage floods, but these are in poor state of maintenance and are at times damaged or washed away during the heavy flow of flood waters, as has been stated by some of the villagers. However, these are stopgap crisis response actions. It is also apparent that structural measures alone are insufficient to manage floods. It requires a better understanding of the broader issues pertaining to climate change, altered rainfall patterns, and significant reduction of green areas and water bodies that act as sponges for retaining excess rainfall in the district and surrounding areas.
In addition, unplanned real estate development at the periphery of cities, with no local government control and building regulation, and a complete absence of environmental assessment of the physical terrain, elevation, and location in the flood plains or on the natural drainage channels that allow water runoff during the monsoon season, are common phenomena across the country, irrespective of their geographical setting or city size. This is partly true in the case of Dhampur as well as is evident in Map 2 that the periphery of the town is more flooded than the core of the town.
To sum up, Dhampur and its surrounding region has to be more aware of the impacts of climate change on the rainfall pattern and build its resilience by taking appropriate mitigation measures. In addition, the Dhampur NPP has to take necessary action to manage local level causes of flooding, including removing encroachments along the Ikkra Nala and restoring its natural width. Equally important is the need to expand and upgrade the town’s drainage system keeping in mind the increasing population growth of the town.
Indian Small Towns’ Romance with Pizzas: A Slice of New Aspirations in Dhampur
In March 2024, my colleagues Shubham Kashyap, Aena Rawal and I were on the road to Dhampur again to resume the field work for our study: Forty Years’ Development Saga of Dhampur: Growth Dynamics and Regional Transformation of an Indian Small Town. While I was busy introspecting about how we will go about our work in Dhampur, I was also noticing everything passing by, the towns and villages, factories, and green fields lush with sugar cane, wheat and mustard crops. Also, the towns and villages we passed through had the string of familiar roadside shops and services that straddle between rural and urban life styles, ranging from fancy clothes and shoe stores, fruit and vegetable stalls, chemists, mobile phone repairs, barbers and beauty salons, construction materials, furniture, household goods, agricultural implements, sweet shops, tea shops, biryani joints, and restaurants also displaying pictures of fast food (burgers, momos and noodles) along with the usual Indian dishes on their boards.
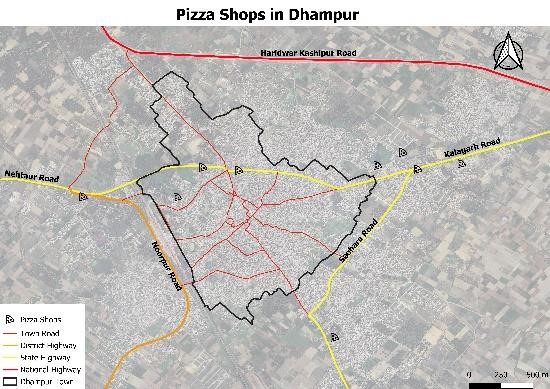
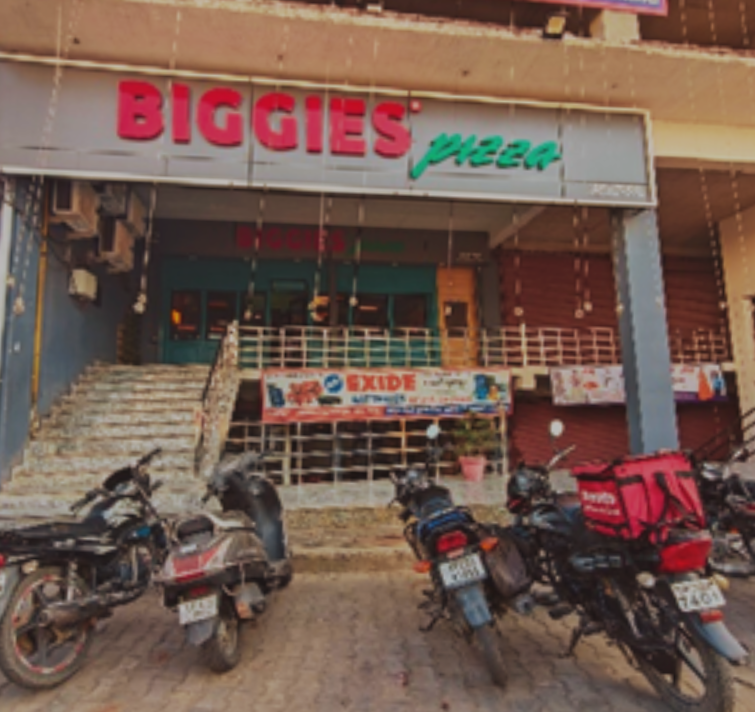
As we approached Gajraula town, I started noticing a few pizza places. When looked closely I found that none of these were popular pizza brands I was familiar with, such as: Domino’s, Pizza Express, Pizza Hut, La Pino’s, US Pizza, Chicago Pizza, Papa John’s, Oven Story and Slice of Italy. There were names like Pizza Slice, Pizza Nagari, ONO Pizza, Roms Pizza, etc. Going around in Dhampur town, we came across several more such as: Biggies Pizza, Pizza Uncle, Pizza Point, Pizza Universe, Friends’ Zone Pizza, Hunger Pizza, Delicious Pizza and Shambhu Pizza.
We preferred to have lunch in a restaurant while being out and about the town as we always had dinner at the Eurasia Palace hotel where we were staying. The numerous street food carts selling popular foods like Parathas, Biryani, Chhole Bhature, Momos and Burgers didn’t appeal to us. There were only two multi-cuisine restaurants in the town that could meet our expectation of hygiene, ambience and choice of dishes, namely the Indian Corner and Gulmohar. Hence, we often ended up in one of the pizza places for a change. To our surprise, we found that the pizza toppings were very similar to what we would find in pizzerias in Delhi and other large cities, and not drastically customised to suit more Indian small-town palate. Some of the larger pizza places also had home delivery services, such as Biggies Pizza, Pizza Uncle and The PizzaBite. The only difference was that none of these restaurants offered thin crust pizzas. However, the price of pizzas was about half the price of what one would pay in well-known pizza joints like Dominos in larger cities, which is understandable keeping in mind the local affordability levels.
Remembering my student days, when going out to eat always meant going to an Chinese restaurant, I wondered what would explain the penetration of pizzas into the Indian small towns and the countryside, as the only international cuisine that is so visible?
After trying out several pizza places and talking to some of the restaurant owners, I came to understand that there are a number of explanatory factors for the popularity of pizza places in a small town like Dhampur:
Pizza Joints Have Not Replaced the Conventional Food Outlets: As is the case in many smaller towns and cities in India, sweet shops also offering a range of savory delicacies continue to be the go-to places for take-aways in Dhampur as well. Khairati’s sweet shop located in Bhagat Singh Chauk is about two hundred years’ old and is the most popular of such sweet shops. Bhagat Singh Chauk in the center of the town also has many snack vendors, where people stop to take a bite while shopping in the market, or just go there for a quick snack. The most well-known of these is about hundred years’ old Jain Kachari Wala who specialises in selling Singhada (Water Chestnut), Lobia Beans and Moong dal Kachari (A slow cooked creamy paste) served with a chunk of butter, green chutney and sweet chutney. Virendra Saini, the third-generation owner of this business, opens this shop at 6 am and closes by mid-day. Food carts continue to serve this dish along with other snacks like Chaat, Samosa, Kachori and Aloo Tiki through the day. In addition, there are several well-known Samosa, Pakora and Kachori shops in the main bazaar street and at key points such as: near the railway station, bus terminal and Nagina Chauraha. But none of these joints offer dine-in facility for a relaxed eating out experience.
Increased Disposable Income: With economic development and more disposal incomes in hand, particularly in India’s urban areas, and also in the neighbouring rural areas, eating out has become the most prominent life style changes. Newer and more eating out options are coming to meet the preferences of the clientele of different income groups.
Impact of Internet and Media: The media and advertising have an undeniable role in promoting various kinds of cuisines that prominent social influencers in large cities prefer to eat. Easy access to internet and platforms like YouTube also makes it possible for young people in small towns and villages to learn more about these new kinds of cuisines.
Changing Aspirations of the Youth: Pizzas appear to be the new exotic food in India’s small towns. Pizza joints meet the aspirations of the younger generation, who think it is fashionable to eat in a fancy restaurant where they can chill out with friends and take pictures. These restaurants also provide a safe space to young men and women who can spend time together without social scrutiny.
Similarities Between Pizzas and Roti-Sabzi: Easy acceptance of its structure and taste, as in a way it is similar to the most widespread North Indian staple Roti-Sabzi, albeit with a bit of tomato sauce and cheese. And, you can make it spicier to match your taste by adding jalapeno toping and chili flakes. Pragmatism of eating it with hands with no fear of being frowned upon for not using unfamiliar cutlery like fork and knife has an additional appeal.
Finally, one can say that popularity of pizzas is one of the indicators of the widespread life style transformation taking place in an aspirational small town like Dhampur.
Note: All pictures are taken by Pushpa Pathak

CPR Insights | Russia and India’s Imports of Petroleum Crude
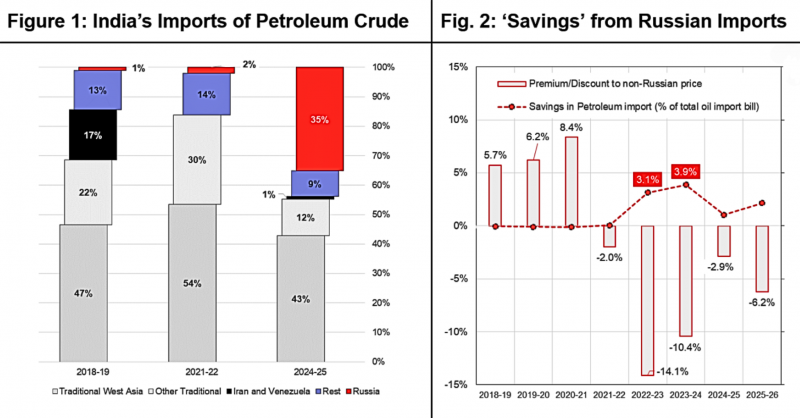
Source: Author analysis of data from EIDB->SYSTEM ON INDIA’s Export Import, Ministry of Commerce https://tradestat.commerce.gov.in/ 2025-26 refers to the first quarter of the fiscal year, i.e., April 2025 to June 2025
Note that “Traditional West Asia” refers to three large sources, viz. Iraq, Saudi Arabia, and UAE. Other Traditional includes USA, Brazil, Kuwait, Mexico, Nigeria and Oman. Together with Russia, they were the top ten sources in 2021-22, before the spurt in crude imports from Russia. Rest comprises other 31 countries from which there were imports under HSN code 27090000 for 2018-19 to 2021-22 and HSN 27090020 for 2022-23 to 2025-26.
Figure 1 shows how the source countries of India’s imports of petroleum crude has changed since 2018-19, with the rise in the share of Russia from 1% in 2018-19 to 35.1% (by value) in 2024-25 (35.8% by volume). However, over this period, there have actually been two transitions.
The first transition, over 2018-19 to 2021-22 (admittedly, a CoVID-affected year), was when India stopped importing from first, Iran and then Venezuela. Their share of 17% in 2018-19, about 41 million tons out of a total of 226 million tons, was largely made up by stepping up the share from traditional sources.
The second transition is the increase in imports from Russia, which goes from 4 million tons in 2021-22 to over 87 million tons in 2024-25. In this shift, the share of Iraq, Saudi Arabia and UAE reduced by 11 percentage points, but since the overall import went from 196 million tons to 244 million tons, their overall quantity remained about the same. However, for the other six countries, not only did their share drop by 18 percentage points, the quantity imported from them reduced by more than half, from over 60 million tons to under 30 million tons. The shares of other countries (‘Rest’) also declined, as did overall imports from them. However, imports from some countries, like Angola and South Korea, show an increase over 2021-22 to 2024-24. Some imports from Venezuela also seem to have resumed. Thus, the increase in imports from Russia has been accompanied by a decrease in imports from many countries, some of whom saw a drastic fall in their exports to India.
Figure 2 compares average unit values (total imports by value divided by imports by volume) of imports from Russia and other countries. Before 2021-22 (this Russia Ukraine war started in February 2022), Russian crude was priced at a premium, while post 2021-22, it was indeed priced at a discount. The discount was substantial in the two years, 2022-23 (14.1%) and 2023-24 (10.4%). This implies savings in the total crude import bill of about USD 5 billion a year or 3.1% and 3.9% respectively, given the counterfactual that Russian crude was substituted with crude at the average non-Russian price. However, if India were to shift to other suppliers, given its import volume, the global price might actually have risen, i.e. this is the claim that US wanted India to buy Russian crude to keep the oil market stable and prices in check. So, the value of savings may have been higher, but it would have been likely be under 1% of the total Indian import bill.
Urban Challenge Fund to Support Tier 2 and Tier 3 Cities: A New Impetus for Spatially Dispersed Urban Growth in India
While chairing the 10th Governing Council Meeting of NITI Aayog on 24th May 2025, PM Narendra Modi observed that: ‘India is urbanising rapidly.’ He asked the states to make cities the engine of sustainability and growth, and urged them to focus on Tier 2 and Tier 3 cities. He noted that a Rs 1 lakh crore Urban Challenge Fund (UCF) is being created for seed money.
In the budget 2025-26, an annual allocation of Rs. 10,000 crores is made for UCF to implement project proposals for `Cities as Growth Hubs’, `Creative Re-development of Cities’ and `Water and Sanitation.’ The Centre will finance up to 25% of the cost of bankable projects provided at least 50% of the cost is funded from bonds, bank loans, and PPPs.
In 2002-03, the government had proposed to set up a similar City Challenge Fund (CCF) to provide incentivised partial public financing for urban infrastructure development. However, no financial allocation was made specifically for setting up CCF. A total of Rs. 24.68 crores were set aside for a wide range of Other Urban Development Schemes, including CCF. This allocation was increased to Rs. 50 lakhs for the financial years 2003-04 and 2004-05. However, no city had accessed CCF, perhaps because the size of the fund was too small and the stipulation of designing and implementing associated city-level reforms was too demanding.
The rationale behind setting up UCF, with a much larger allocation of funds, is the realisation that the limited public finance must be leveraged to raise funds from the market for improving urban infrastructure and services. This is because municipal revenues have not increased significantly in most cities, but have remained stagnant on an average at about 1 per cent share of GDP between 2007-08 and 2017-18 as reported in the 15th Finance Commission Report.
At Rs. 10,000 crores per year, the size of the UCF kitty is definitely huge in comparison. But the question is: Are Indian cities, particularly in Tier 2 and 3 categories, better equipped to access partial funding from UCF while raising the remaining resources from the market two decades later?
The current scenario is more positive for possible successful implementation of UCF. First, though only 16 cities have opted to raise funds through municipal bonds, a significantly larger number of cities have some experience of PPP arrangements for infrastructure development. Second, all projects eligible under the three categories for UCF funding have some revenue generation potential. However, many Tier 2 and Tier 3 cities may not have the capacity to design large infrastructure projects with complex funding arrangement including bonds, bank loans, and PPPs to qualify for UCF support. Hence, the central government should make the following policy changes to enable Tier 2 and Tier 3 cities to access UCF funds in the next five years:
First, increase the government incentive from the proposed 50 per cent to 60 per cent, with 30 per cent being central grant and matching 30 per cent coming from the state governments, and to reduce market borrowings and PPPs to at least 40 percent. This will also be in line with the current government practice as is followed by the Ministry of Finance for implementing the Viability Gap Funding scheme for supporting infrastructure projects undertaken through PPPs with the similar objective of making them commercially viable.
Second, synchronise UCF funding with other ongoing government schemes to optimise their outcomes, in particular: Commerce Ministry supported formulation of ‘City Level Economic Vision for 100 Tier 2 and 3 Cities’ by June 2026, as a part of nationwide reforms to create manufacturing hubs in 1,039 cities; and Niti Aayog’s Growth Hubs Initiative currently covering 4 cities that is to be scaled up to 16 cities. This would help states and cities to identify a few low hanging bankable urban infrastructure projects suitable to get funding from UCF with relative ease and speed.
Third, as the central government is interested in broad-basing its support to tier 2 and Tier 3 cities, and these cities may require technical support for preparation of bankable projects, some allocation should be made for financing it while formulating the operational design of UCF.
To conclude, supporting Tier 2 and Tier 3 cities will help in fulfilling the country’s aspiration of becoming Viksit Bharat by 2047 as well as in meeting the objective of realizing a more spatially dispersed and equable urban growth pattern in India.