AN ANALYSIS IN THE RUN-UP
ELECTION STUDIES POLITICS
As 8 November approaches, read CPR researchers Neelanjan Sircar, Bhanu Joshi and Ashish Ranjan’s latest piece from the field on what is the likely result of the Bihar elections.
With no clear answer, their field observations analyse the importance of and the difference between the ground-level campaigns run by the Grand Alliance and the NDA. Whatever be the final outcome, the impact of the results of these elections will reverberate throughout Indian politics, they write.
5 March 2019
Green industrial policy is a timely idea for India to explore
CLEARING THE AIR: MONTHLY COLUMN IN THE HINDUSTAN TIMES BY NAVROZ K DUBASH
AIR POLLUTION POLITICS
In the second instalment of a monthly op-ed series in the Hindustan Times entitled Clearing the Air, Professor Navroz K Dubash argues that green industrial policy is a timely idea for India to explore.
How can India simultaneously grow and create jobs, attend to its growing environmental crisis, and proactively address inequality? Conventional thinking holds that these objectives can only be achieved sequentially — grow first and clean up later; or grow first and redistribute later. An emergent set of ideas suggests we can do better.
The core idea emerges from a debate over the role of the government in development policy. Should the government limit itself to providing law and order, fiscal health and enabling well-functioning markets, as argued in the Washington Consensus of the 1990s-2000s? Or should it actively steer the course of development — an approach which resulted in the East Asian miracle growth in South Korea and Taiwan in the 1970s-80s — through the use of industrial policy that targets key directions and sectors?
This debate takes on new salience and energy in the light of India’s environmental crisis and the global challenge of climate change. To address these challenges will require a wholesale restructuring of the economy through upstream shifts in technology and infrastructure investments. Facilitating this requires more active government intervention beyond end of pipe pollution regulations and environmental taxes.
To make matters even more complex, inequality and justice are a necessary part of this conversation. Big shifts bring disruptions, and these disruptions are far more politically viable if they actively create opportunities for those who may otherwise be left behind.
Globally, this discussion is moving from the shadows to the mainstream. China is actively steering its economy to provide competitive advantage in the renewable energy industry. Discussion of a Green New Deal in the US has progressives calling for a green transformation of infrastructure that mainstreams climate change considerations while creating jobs. And street protests over a fuel tax in France have spurred European conversation on whether green policy is viable without actively considering social inequality.
This conversation is deeply salient to India. First, for a country growing at 6-8%, up-front directional shifts can have a big impact. India has an opportunity to choose more environmentally sustainable pathways in areas such as rail, housing, and energy demand. Without active steering, India could lock itself into an energy inefficient and environmentally poor growth path.
Second, as countries face global climate change, being green is likely to bring global competitive advantages. For example, can India become a world leader in integrating energy efficiency, or in modelling frugal forms of resilience to climate impacts, which other developing countries can emulate?
Third, India has already experimented, with some success, with State-led nudges, notably in the area of promoting LED lights through public procurement policies. But to fully exploit the opportunity, a strategic approach that draws on the full suite of industrial policies — careful subsidy and incentives, innovation, public investment and procurement — need to be brought into play.
Fourth, India has to proactively internalise questions of distribution and justice if we are to undergo a green transition. For example, a shift to renewable energy will invariably bring costs to coal-rich states, without upfront efforts to develop new sources of livelihoods and support for communities.
Can India successfully develop a green industrial policy, or, to use the metaphor of the day, can we Green India by Making Green in India? There is at least one cautionary note: Doing industrial policy well requires a very nimble State. Given the history of the licence raj, industrial policy should ideally not try to pick winners but “pick the willing” — companies keen to take advantage of green industrial policy — in the words of economist Mariana Mazucatto, a thought leader in this emergent area. But, to do so, the State has to have the strategic capacity to identify growth areas, understand the needs and constraints of industry sufficiently to develop complementary policies, yet have enough autonomy not to be captured by industry.
Recent experience with direction setting by the Indian government suggests a rush to announce dramatic new pathways but a lack of capacity to build the underlying support structure. We proclaim renewable energy or electric vehicle targets, but fail to anticipate the consistent and careful policies required to support them. For example, ongoing research on green industrial policy by Easwaran Narassimhan, a PhD scholar, finds that the solar mission’s efforts to create a domestic solar industry and support solar jobs fall far short. Not least, the third pillar, proactive engagement with the distributive justice agenda, is conspicuous by its absence.
Green industrial policy is a timely idea for India to explore. We need jobs, we need greening, and we cannot achieve both without addressing distributive questions. Nor can we postpone any of these objectives. But the conditions for success are stringent, and include a far more capable State.
Navroz K Dubash is a Professor at the Centre for Policy Research. This is the second article in a monthly op-ed series in the Hindustan Times entitled ‘Clearing the Air.’ The original article, which was posted on March 4, 2019, can be found here.
CPR-NAMATI TEAM PUTS IT IN PERSPECTIVE
ENVIRONMENTAL JUSTICE
The recent news regarding the cancellation of a fine imposed on the APSEZ (Adani Ports and Special Economic Zone Limited) for environmental non- compliance by its Waterfront Development project (WDFP) in Mundra, Gujarat has set off a series of clarifications by the Ministry of Environment, Forests and Climate Change.
The Ministry’s institutional response to this project will have a bearing on how corporate non- compliance of environment law is legally treated by environmental regulators.
However, this issue and the clarifications offered by the Ministry cannot be understood without the history of the project’s violations that have been recorded by several teams as well as official authorities.
The CPR-Namati Environment Justice Program works on understanding the regulatory and institutional challenges to enforcement of environmental laws. As part of its ongoing work, it has tracked the regulatory history of this project, which is shared below:
The conditions under which this project came to be set up in this part of the Kutch coast have been reported as a favour to the company by the then political party in power in the state. The project was granted environmental clearance under the Environment Impact Assessment Notification in 2009. After the project was established, the Environment Ministry issued two show cause notices in 2010 and 2013. These raised issues of mangrove destruction, illegal siting of project staff’s residential township and non-compliance of other conditions of the environmental clearance.
In 2012, the CPR- Namati Environment Justice Program, that works on issues of environmental compliance, collaborated with the Mundra Hitrakshak Manch (Forum for the protection of Mundra) to undertake a research study of the environmental compliance of the project. The report titled ‘Closing the Enforcement Gap: Findings of the Community Led Groundtruthing of environmental violations in Mundra, Kutch’ was published in 2013. The report presented detailed evidence on non-compliance using satellite images, photographs, impact studies and local testimonies. This was officially submitted to the Environment Ministry.
Even as the study was being done, the Central government set up a committee headed by Centre for Science and Environment’s Sunita Narain in September 2012. It was to look into the complaints received by the ministry on environmental violations and the “severity of issues involved”. From what is known publically, the Committee undertook field visits and spoke to affected people as well as the APSEZ officials. It put out its report in 2013 which stated on page 81 that ‘there is incontrovertible evidence of violation of EC condition and non-compliance…’. The report took the stance that ‘it is not possible or prudent at this stage to halt or cease its operations.’
Articles in The Hindu and The Economic Times pointed out that the report did not provide any methodology or legal basis for calculating the fine of Rs 200 crores and it called this fine an ‘Environment Restoration Fund’. The damage caused due to the violations was not only to the environment, but also to fishing families, coastal pastoralists and farmers who had suffered livelihood and economic hardships for years. Along with being major legal offences, violations of environment law lead to social, economic and psychological costs borne by scores of poor and vulnerable citizens in whose neighbourhoods these projects operate.
This WFDP is located within Adani’s SEZ (Special Economic Zone) in Mundra. On 13 January, 2014, the Gujarat High Court (HC) observed that the operations of the SEZ were being carried out without an environment clearance. The HC questioned the Adanis’ stand on operating with a ‘deemed clearance’. The High Court also directed the Ministry to take a decision on whether environment clearance should be granted to the SEZ post facto. In July, 2014, this approval was granted.
Setting aside the two show cause notices and the observations of the Committee regarding repeated violations, the Ministry raised doubts over whether the violations had ever occurred.
In file notings received through a Right to Information (RTI) application in 2015, the Ministry concluded that the APSEZ is not a violator. The Ministry concluded that while mangrove destruction and other damage had taken place it could not be attributed to the company. The RTI documents reveal that the Company disagreed with the violations observed by the Committee. The RTI documents can be accessed here.
The recent article that stated that the Ministry has ‘dropped’ the penalty has sent it into a huddle. The Ministry is reported to have issued a statement that they will impose an ‘open ended financial commitment’ that could be greater than the Rs 200 crores fixed by the Narain Committee as well as ensure that restoration of the landscape is undertaken
It remains unclear how this fine will be computed and whether it will be legally tenable when the 2009 project approval letter emphatically states that non compliance of clearance conditions can lead to the revocation of the environment clearance.
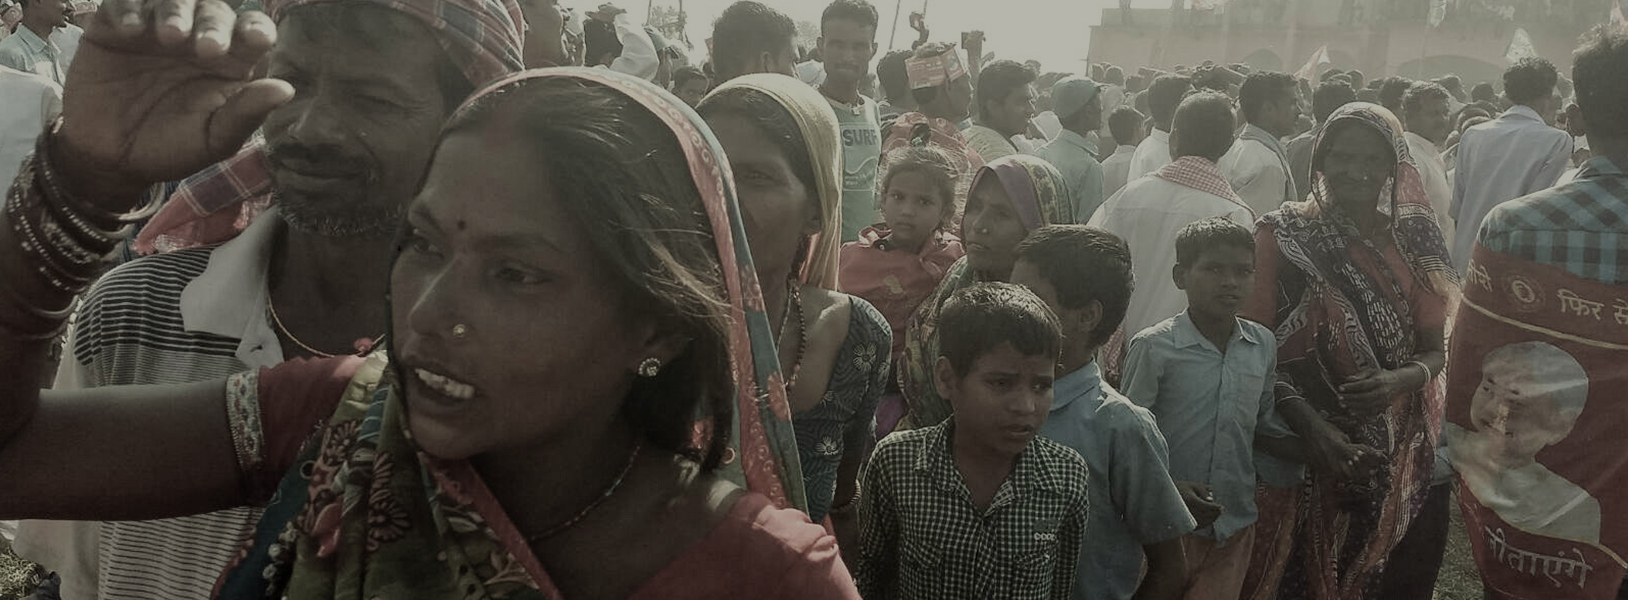
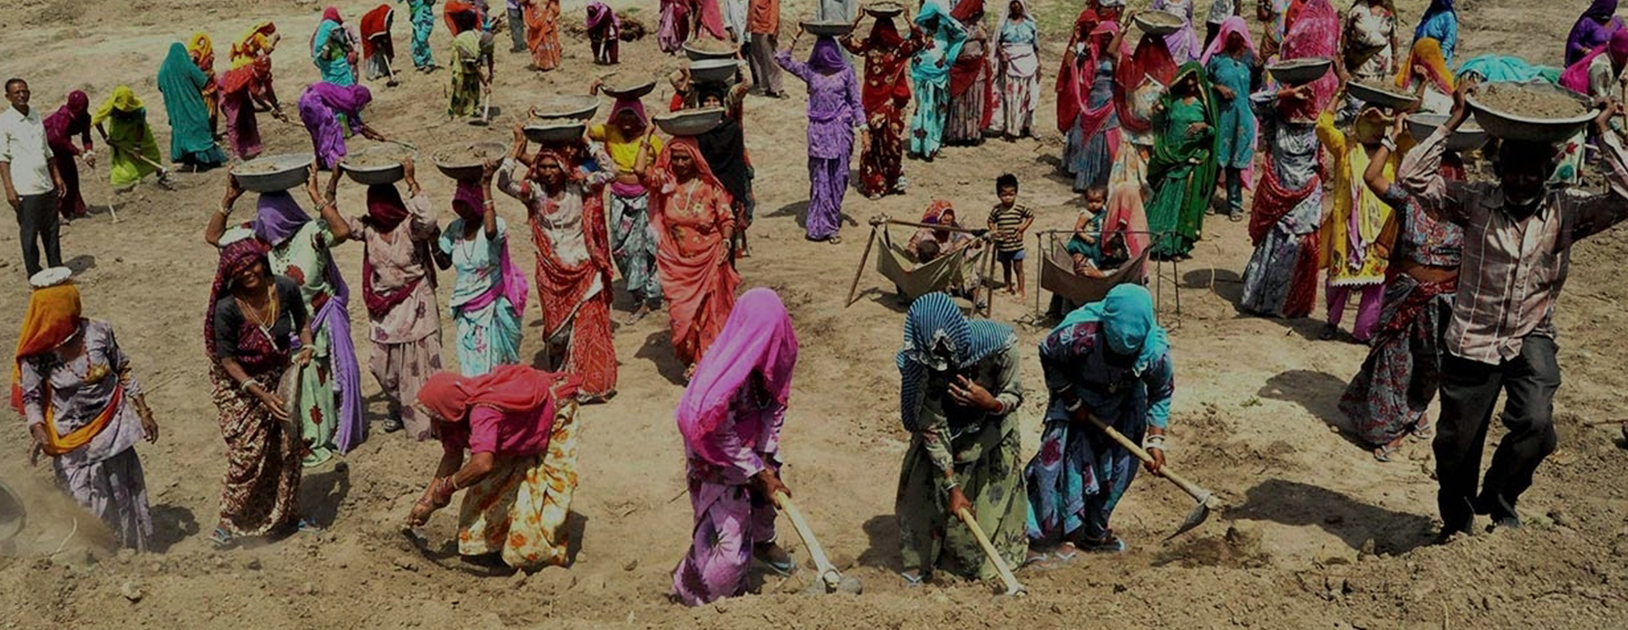
A comparison of Mahatma Gandhi National Rural Employment Guarantee Scheme (MGNREGS) demand and supply of work between the first quarter of FY 2020, when the national lockdown was in place and the first quarter of FY 2021 when the second wave was at its peak offers a useful window into understanding the extent to which MGNREGS has provided robust support to rural India and the role of the Government in ensuring relief and protection to the vulnerable during the deadly second wave.
Demand vs Supply
In 2020, when the ravages of COVID-19 and associated policies became visible, the MGNREGS provided a much needed the lifeline to most of India’s rural poor. Budgets were enhanced significantly. In FY 2020-21 Rs. 1.1 lakh crore (including payments due)[1] was spent on the scheme. As many as 7.55 crore households[2] across the country were given work through the year. However, demand for work consistently outstripped supply. A clear indicator that rural distress and unemployment persisted despite the opening up of the Indian economy in June 2020 after the national lockdown was lifted and a relatively healthy growth in agriculture.
In 2021, as the second wave hit, rural India suffered this time from the combination of health and economic shock. Once States began to announce lockdowns, unemployment rates rose once again. In April and May 2021, the Centre for Monitoring the Indian Economy (CMIE) recorded national unemployment rates at 7.97 in April and 11.90 per cent in May[3]. Unemployment in rural India increased from 7.13 percent in April 2021 to 10.63 in May 2021[4]. However, unlike in 2020, MGNREGS work was not provided at the scale needed.
In the first quarter of 2020, when the national lockdown was in place, (months of April, May and June 2020), demand for work under MGNREGS rose to new highs, touching 4.47 crores in June, the highest of the year[5]. Despite this sudden, massive increase in work demand, the response was robust and work availability high. May in particular saw 3.73 crore households demanding work, and 88.5 per cent of this demand, or 3.3 crore households were provided work[6]. MGNREGS not only proved to be the most important entitlement protecting India’s workers, it also proved to be elastic. Expanding, at speed, when needed and contracting when demand was low. It is important to note however, that despite this expansion, demand consistently outstripped supply.
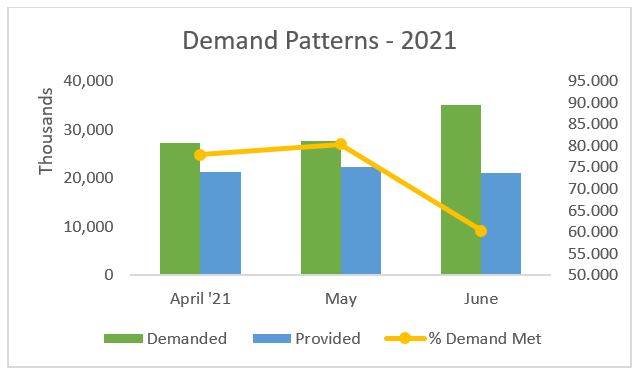
Conversely, for the same months of 2021, not only was overall demand for work lower than in 2020, but supply of works was even lower. In comparison to the high of 4.47 crore households who demanded work in June of the previous year, 3.5 crore households demanded work in June 2021 – the highest of the year so far (as on 8th July, 2021)[7]. Despite this lower demand for work, the overall supply of works has been even lower for May and June 2021 than in the same months of 2020. This means that even though fewer people were turning to MGNREGS in rural areas this year, lesser work (and therefore, income) was being provided under the scheme. In May 2021, 2.76 crore households sought work through MGNREGS[8], but only 2.22 crore households (80.3 per cent) received work[9]. While the figures for June 2021 continue to be revised, current numbers suggest an even starker difference in the work demand met between June this year and the last. States like Madhya Pradesh, Rajasthan, Bihar, and Tamil Nadu met much less demand for work in 2021 over these three months than they did last year[10]. In contrast, the proportion of unmet demand in Uttar Pradesh, Maharashtra, Kerala and West Bengal was higher last year than this.
High pending liabilities
One of the long persistent challenges with MGNREGS implementation has been the delays in payments from one financial year flowing into the next year, because of bottlenecks in fund availability. Many states start the new financial year with pending liabilities or unpaid wages or material costs that need to be paid off as soon as new budgets are announced and monies released at the start of the financial year. The problem with high pending liabilities is that new budgets allocations are used to meet these liabilities and governments’ resorts to rationing demand, creating a vicious cycle of delayed payments.
In the first quarter of FY 2021, this all too familiar pattern unfolded, except this time given high rural distress, the costs have been higher. Nation-wide, total pending liabilities for FY 2021 was Rs. 9,810 crores[13]. There are important State wise differences. Madhya Pradesh opened the financial year with pending liabilities amounting to 697.57 crores[14]. As on 15th July 2021, the State has already utilized 98.17 per cent[15] of its available funds. A similar pattern has unfolded for Chhattisgarh, Himachal Pradesh and Uttarakhand, all states with high liabilities of previous years, also registered high rates of fund utilization. Demand for work has not abated in these States. In the first quarter of FY 2021, unmet demand in Madhya Pradesh was 18,42,054, for Chhattisgarh, it was 9,05,930, and for Uttarakhand, it was 1,24,938 households respectively[16]. It is likely therefore that these states will once again close the year with high pending liabilities and indulge in demand rationing, unless budgets are expanded.
Bihar’s case remains unique here: despite high rates of unmet demand for work and pending liabilities, its utilization of the available funds stands at only 83.49 per cent[17].
State
% Utilisation (’21-’22)
Chhattisgarh
90.94
Tamil Nadu
64.7
Madhya Pradesh
98.17
West Bengal
57.8
Uttarakhand
92.09
Karnataka
63.59
Bihar
83.49
This pattern of high unmet demand (despite relatively lower ‘demand for work’ in 2021) and high utilization of funds is indicative of the fact administrative prioritization of providing ‘relief’ has been missing. In May 2020, the Government of India announced a relief package with substantially enhanced budget allocation for MGNREGS. This resulted an immediate increase in supply of MGNREGS works for much of rural India. Perhaps expecting the economy to be back on a recovery path in the FY 2021 budget, fund allocations were reduced from a total of Rs. 1,11,500 crores in FY 20[19] to Rs. 73,000 crores in FY 21[20]. Once the COVID-19 second wave hit, there was the expectation that MGNREGS would once expand to respond to the increased demand. However, this has not happened. It is often argued that budget allocations for MGNREGS are irrelevant because this is a ‘demand based’ program and funds are made available based on labour budget estimates provided from the ground. However, the reality is that when budget allocations are low, governments resort to rationing demand. Relatively low demand compression in 2021 is indicative of precisely this phenomenon. The fact that despite lower demand, work supply could not keep up is also indicative of the fact that claims that funds for MGNREGS are elastic are false. Low availability of funds inevitably means demand remains unmet thus undermining the ‘demand based’ entitlement that lies at the heart of the MGNREGS.
Looking forward
Last year, the COVID-19 lockdown-related distress mainly affected the non-agricultural sectors of the rural economy. The reasons for this was first, agricultural activities were exempted from any lockdown restrictions, and second, a very good monsoon. 2019 and 2020 were both surplus monsoon years and they produced bumper harvests. That, in combination with record MGNREGS person-days job generation, helped contain rural distress to an extent.
This year, the monsoon’s progress has not been up to initial forecasts. Unseasonal pre-monsoon showers (this May was the wettest May in 31 years) seemed to have disrupted normal heating patterns required for the formation of low pressure areas. As a result, the start of the monsoon season (June-September) saw an initial burst of high rainfall, only to stall after the third week of June. In fact, the northern limit of the monsoon has not moved at all since June 19 and only revived in mid-July. The Met Department’s latest forecasts suggest that the monsoon activity will revive from around July 10. But precious time has already been lost. The bulk of sowing of kharif crops happens between mid-June and mid-July. The crop sown after mid-July will not have enough time for vegetative growth, which will ultimately have a bearing on crop yields. Also, the enhanced possibility of the development of “negative Indian Ocean Dipole” conditions during July to September (most global climate models are predicting this) casts a cloud over the monsoon’s performance in the remaining part of the season.
There is thus a need to be proactive in pushing MGNREGS and planning for a sub-par agriculture year. The number of COVID cases is falling in rural areas and economies are slowly opening up. However, India is staring at the possibility of a long months of persistent rural distress. The time for action is now.
This note, part of the Understanding the Rural Economy series by CPR, has been authored by Yamini Aiyar, Avani Kapur and Harish Damodaran with research support from Ragini Rao Munjuluri and Samridhi Agarwal. Read other notes in the series:
Find all previous notes as part of the series here:
FULL VIDEO OF THE DISCUSSION
INTERNATIONAL POLITICS
Watch the full video (above) of the discussion on the Global Rise of Populism across the world (Denmark, France, Germany, Italy, Turkey, UK, US, Asia), where Bruce Stokes shares findings from Pew Research Center’s surveys on public attitudes behind this populist backlash.
The surveys explore the reasons behind voters’ growing distrust of elites, including perceptions about ‘well-being’, ‘global importance’, ‘inequality’, ‘immigration’, ‘terrorism’, ‘crime’, ‘economic growth’, and more.
Stokes is the Director of Global Economic Attitudes at Pew, a US-based fact tank that has conducted surveys in 85 countries since 2002, including in India. The discussion was organised in collaboration with JustJobs Network.
Watch the full video (above) of the lecture on ‘Hate Speech or the Speech We Hate’ featuring Salil Tripathi.
What constitutes hate speech and what makes it dangerous? The term hate speech has been defined loosely and takes different interpretations for the speaker and the listener. The speakers who express views forcefully believe they are expressing their right to speak freely. The listeners consider the speech they don’t like or agree with as hate speech. Laws impose restrictions on free speech in most jurisdictions, and litigation can restrict free expression of ideas. But sustained hate speech can kill – genocides begin with normalisation of hatred through speech – action follows later, as examples from Rwanda and Bosnia show. A new framework, which distinguishes between hate speech and dangerous speech can provide clarity to distinguish between speech that promotes hate and violence and the ideas we hate but are merely controversial, provocative, hurtful, shocking, and disgusting for some. Negotiating that space is the challenge for democracies in the age of the Internet.
Salil Tripathi is the Chair of the Writers in Prison Committee of PEN International, since 2015. He is an award-winning journalist and writer.
READ THE PAPER BY KANCHI KOHLI
ENVIRONMENTAL JUSTICE
This essay examines the role of India’s 2006 Forest Rights Act in the procedures that regulate transfer of forest land to large infrastructure projects. Specifically, it shows the gap between the legally mandated requirements and how these are implemented in project approval processes. This is illustrated through a case study of the coal mining approvals in the Hasdeo Arand forest region in the central Indian state of Chhattisgarh. The essay also outlines the different actors who have influenced the discourses on forest rights of Adivasi and other forest dwelling communities and what they identify as factors that challenge the implementation of this law on the ground. It juxtaposes this analysis in the context of the recent decision of the Supreme Court of India on eviction of forest dwellers and examines whether that would bring in any structural change in the way the law is implemented.
RAJIV KUMAR PARTICIPATES IN PANEL DISCUSSION ON ET NOW
ECONOMY
Rajiv Kumar participates in a discussion (full video above) on ‘remonetising’ India, a Times Network initiative, after the expiry of the 50-day-deadline
READ THE BLOG BY SHYLASHRI SHANKAR
IDENTITY DISCRIMINATION POLITICS RIGHTS
The Citizenship Amendment Act (CAA) 2019, when viewed in combination with the Modi government’s intention to compile a National Register of Citizens (NRC) for India, will create a situation where being a Muslim and document-less could deprive one of citizenship rights. We may find more conversions out of Islam, and perhaps more takers for the Sangh Parivar’s ‘Ghar Wapsi’ programme. All this could occur even if the state governments in non-BJP ruled states do not cooperate with the Modi government on implementing the NRC. Ironically, it is the very process of democracy – elections and manifestoes – that will end up damaging the citizenship rights of the Muslim minority in India.
Let me explain how the combined threat of CAA and NRC could play out. Currently there are four ways to become an Indian citizen: birth, descent, registration and naturalisation. The Citizenship Bill of 1955 does not allow illegal migrants to acquire citizenship but the recent amendment allows non-Muslim minorities escaping persecution from three countries to do so.
The CAA welcomes Hindus, Sikhs, Christians, Parsis, Buddhists and Jains who arrived in India before 31 December 2014 to escape religious persecution as minorities in neighbouring Pakistan, Afghanistan and Bangladesh. All three happen to be Islamic states. The CAA, however, does not include Muslim minorities like the Rohingyas of Myanmar (with whom we share a border).
Let’s move to the NRC exercise. It is not yet clear what sort of documentary proof would be required to prove citizenship because the exercise would be conducted by state governments, and perhaps each state government could have its own specifications. Let’s assume that one of the documents is a birth certificate. UNICEF figures from 2012 report that about 40% of urban births and 65% of rural births are not registered in India. A similar picture is probably the case for the older generations. In Assam, reports suggest that large numbers (about 19 lakh people) did not possess the necessary documents in the recently conducted NRC exercise under the supervision of the Supreme Court. Detention camps have already been set up in Assam. ‘We want to root out illegal infiltrators coming from Bangladesh and other neighbours to other parts of India,’ the Union Home Minister Amit Shah has already said while defending their intention to carry out the NRC. He has also made public threats that those who cannot produce the necessary documentation will be herded into detention camps.
For a non-Muslim who may have lived in India for centuries but who doesn’t have a birth certificate, all is not lost. He or she can argue that they have no place to go or that they have fled these neighbouring countries to escape persecution (and have left their documents behind). But a document-less Muslim cannot make such an argument because the CAA does not include Muslim minorities. Being branded as an illegal and put in a camp would loom large in the realm of awful possibilities for such a person.
Wouldn’t the dispossessed have recourse to the courts? Would the courts stop the NRC process? Well, after the Ayodhya judgment which favoured Hindu claims over a disputed site, and in the face of the government’s contention that the NRC exercise is necessary in the interests of national security (an argument that usually ensures that the court favours the government in anti-terror cases), it seems a chancy business to rely on the court.
As for the constitutionality of the CAA, which has already been challenged, the Supreme Court judges will probably decide using the concepts of ‘intelligible differentia’ and ‘rational relation to the goal’ in Article 14 (equality before the law).
The specification of the minority communities in the CAA could be challenged in court on two grounds:
a) That citizenship eligibility of these migrants pertains to religious attributes and excludes ethnic and racial ones. Ahmedis and Shias of Pakistan suffer discrimination but will not be eligible under the CAA because they belong to the majority religion (though Ahmedis have been categorised as ‘non-Muslims’ by the Pakistani laws).
b) That the exclusion of ethnic attributes was deliberate in the Act because including it would allow Rohingyas (who are mainly Muslim) to apply for Indian citizenship.
The court’s response would depend on whether they immediately extend the persecution argument to more categories such as ethnicity, or accept the government’s assurance that it would do so in the future (a more likely scenario).
Opponents of the amendment could point out that the Constituent Assembly (CA) had vetoed the notion that India would be the homeland for Hindus. A CA member (P.S. Deshmukh) had proposed an amendment to include as Indian citizens every Hindu or a Sikh who was not a citizen of any other state because Hindus and Sikhs had no other country to look to for acquiring citizenship rights. The amendment was rejected by the majority.
The opponents of the CAA could also argue that the constitution framers wanted to ensure that independent India adhered to the principles of a secular State. They may point to the words of a CA member Alladi Krishnaswamy Ayyar: ‘We may make a distinction between people who have voluntarily and deliberately chosen another country as their home and those who want to retain their connection with this country. But we cannot on any racial or religious or other grounds make a distinction between one kind of persons and another, or one sect of persons and another sect of persons.’ Ayyar had gone on to explain that Article 5A, clause (a) of the draft constitution did precisely this: it provided for ‘all cases of mass migration-if I may use that expression-from Pakistan into India… We do not in that article make any distinction between one community and another, between one sect and another. We make a general provision that if they migrated to this country and they were born in India as defined in the earlier Constitution, then they will be entitled to the benefits of Citizenship.’
It is true that India’s constitution framers did not expect the articles dealing with citizenship to be set in stone. A CA member noted that the ‘articles dealing with citizenship are, therefore, subject to any future nationality or citizenship law that may be passed by Parliament. Parliament has absolutely a free hand in enacting any law as to nationality or citizenship suited to the conditions of our country.’ So there is nothing wrong in amending the Citizenship Act.
But when seen in tandem with the NRC exercise, the CAA is not simply an amendment to provide safe haven to persecuted minorities, none of whom are Muslim. It would be more precise to say that the CAA is pro-non-Muslim persecuted minorities. The NRC exercise is being conducted to find illegal migrants from neighbouring countries particularly Pakistan and Bangladesh (which also has the third largest Hindu population after India and Nepal). A possible impact of the NRC-CAA combine would be the following: A document-less Muslim in India who may have lived here for centuries may be more likely to be branded an illegal migrant, but without recourse to the CAA that a Hindu Bangladeshi migrant would have. Wouldn’t such an awful possibility create fear in the hearts of Indian Muslims?
Even worse, such fears, and perhaps even the reality of being stripped of citizenship are a result of the very democratic process that allows a victorious political party to make the claim that all its pledges are backed by the people’s mandate. But we all know that as voters, we may vote for a party without agreeing with all parts of its manifesto. In the 2019 UK elections, Labour party strongholds turned conservative because those voters preferred Boris Johnson’s stance on leaving Europe even though they may have championed the Labour party’s strategy for the economy. A similar argument can be made for voters who may have voted for Modi in 2019 on other issues. CAA and NRC may not have the endorsement of a majority of Indians but we have no way of knowing that unless we conduct a referendum.
More crucially, the CAA-NRC combine inflicts a deep wound on the constitution’s fabric. Even if the NRC exercise doesn’t happen, the damage would have been done to several fundamental rights including the right to practice religion. It would cause the ‘mischief of Partition’ to travel across decades. As a constitution framer said, ‘I see no reason why a Muslim who is a citizen of this country should be deprived of his citizenship at the commencement of this Constitution.’ But the CAA-NRC does precisely that by creating a fear psychosis among document-less Muslim citizens of India about their citizenship rights and about their ability to remain in their religion.
The views shared belong to individual faculty and researchers and do not represent an institutional stance on the issue.
RECENT NEWS
29 DECEMBER 2021
‘Know Your Regulator’: Mr P.K. Pujari, Chairperson, Central…
23 DECEMBER 2021
The future of MSP
10 DECEMBER 2021
Briefing Note: Central Electricity Regulatory Commission
NEWS ARCHIVE
FILTER BY TAGS
Identity Discrimination×Politics×Rights×
Type Here
Identity DiscriminationPoliticsRightsAir PollutionBudgetBureaucracyClimate ChangeClimate ResearchCoastal GovernanceCPRCPR ViewsEconomyEducationElection StudiesEnergy ResearchEnvironmental JusticeFiscal DevolutionGovernanceHealthHousingIndia-PakistanInternational PoliticsKashmirLandLand AcquisitionMigrationObituariesParis AgreementPlanningPodcastSanitationSanitation ManagementSecuritySocial Sector SchemesSouth AsiaTechnologyUrban EconomyUrban GovernanceUrban ServicesUrbanisationUrbansanitationWater ResearchWater Resources
FILTER
FULL VIDEO OF THE DISCUSSION
INTERNATIONAL POLITICS
Watch the full video (above) of the discussion on ‘How East Differs from West? A Tale of Two Globalisations’, featuring Stephan Shakespeare, Pramit Bhattacharya and moderated by Rahul Verma.
Drawing on data from the YouGov-Cambridge Globalism project that consists of extensive multidimensional surveys conducted in 23 countries, the discussion centred around the changing geography of globalisation as it is not just shifting economically but also publicly. The pro-globalisation public consensus that used to characterise Western politics is essentially moving to the East. This raises an important question: has the traditional link between globalisation and the spread of Western liberal norms around the world been permanently broken?
Stephan Shakespeare is the CEO and Co-founder of YouGov. Pramit Bhattacharya is a Data Editor at Mint. Rahul Verma is a Fellow at CPR.