What ails Chhattisgarh’s welfare schemes?

ACCOUNTABILITY INITIATIVE ANALYSES PUBLIC DELIVERY OF SCHOOL EDUCATION AND NUTRITION IN THE STATE.
SOCIAL SECTOR SCHEMES BUDGET BUREAUCRACY

Context

In partnership with the Chhattisgarh government and UNICEF, the Accountability Initiative (AI) undertook its flagship PAISA (Planning, Allocations and Expenditures, Institutions Studies in Accountability) study to track the use of development funds in the state, with the data collection conducted in 2015.

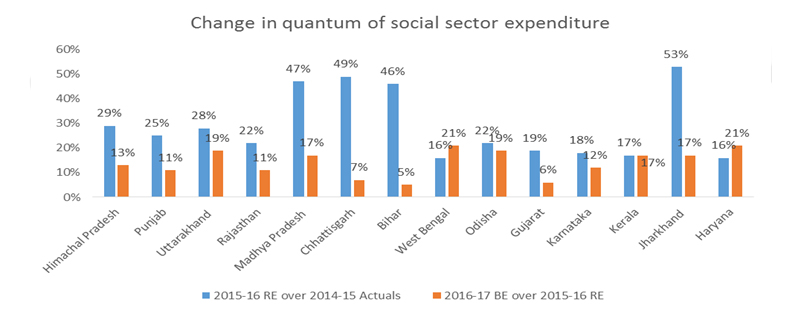
As a first step, the study compared Chhattisgarh’s performance to its peers. As a result of the implementation of the FFC (Fourteenth Finance Commission) recommendations, designed to enhance fiscal autonomy to states, Chhattisgarh received a significantly higher proportion of untied funds from the Union government in 2015-16 (as per revised estimates or RE) compared with 2014-15 (Actuals) – overall central transfers increased by 65% in this period. Interestingly, Chhattisgarh appears to have used a significant portion of its untied money toward investments in social sector programmes. When compared with 2014-15 (Actuals), investments in social sector increased by 50% in 2015-16 (RE).

The study then took an in-depth view of the implementation of four important Government of India sponsored social sector schemes. These were – Sarva Shiksha Abhiyaan (SSA) for elementary education of children aged 6 – 14; the Midday Meal Scheme (MDM); Rashtriya Madhaymik Shiksha Abhiyaan (RMSA) for secondary education; and the Integrated Child Development Scheme (ICDS). The study evaluated the nature and effectiveness of public service delivery of school education and nutrition in the state. The data was collected from four districts – Rajnandgaon, Surajpur, Janjgir Champa and Bastar – which were decided upon in consultation with the state administration.

A mixed method approach was employed, wherein both quantitative and qualitative data was collected in order to achieve a comprehensive picture of the ground reality. The quantitative data illustrated the existing situation in fund flow and public service delivery and was collected through both primary and secondary sources. Additionally, qualitative interviews were conducted with both frontline workers and senior bureaucrats in charge of implementing the schemes at the block and district levels.

Rigorous analysis of the data reflected some overarching implementation gaps across all four schemes:

Limited human resources and weak internal management resulting in poor supervision;
Insufficient planning capacity and lack of prioritised resource allocation at the grassroots;
Delayed fund flows and a complicated disbursement process.
Key Findings

The key findings specific to each of the schemes are summarised below.

Sarva Shiksha Abhiyan and Rashritya Madhyamik Shiksha Abhiyan

Teacher shortage: Vacant teaching posts, compounded by absenteeism, impacting teacher ‘availability’, was a prominent concern faced by most schools. Multi-grade teaching (students of different grades sitting in the same classroom), particularly in secondary schools, led to an adverse effect on quality of education. This was particularly evident for subjects like Science and Mathematics where the same teachers had to double up to teach both subjects.

Moreover, while the state found it tough to recruit teachers for its secondary schools, those that were hired didn’t necessarily report in schools to teach. Measured as on the day of the survey visit, teacher absenteeism was high especially for subjects like Hindi, English, Science and Social Science, and more so in tribal districts. This was also true for primary school teachers where over 20% of all recruited school teachers were absent on the day of the main survey. Additionally, the study found that under RMSA, salaries of a decentralised teacher cadre – the Shiksha Karmis/Panchayat Shikshaks ­– were often delayed, and thus they had little incentive to work.

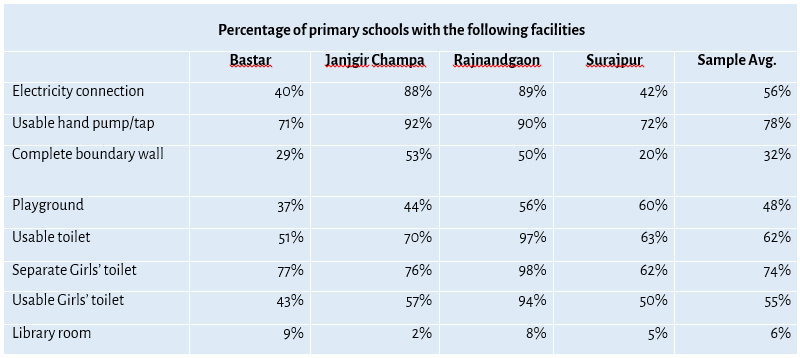
Gaps in infrastructure provision: With high rates of enrolment, Chhattisgarh has the lowest proportion of out-of-school children (4%) both in comparison to other states, as well as the national average. Yet, infrastructure provision remains poor. A survey of SSA in primary and secondary schools in the four districts studied showed that despite several years of the Right to Education being in place, gaps remained in provision of key infrastructure facilities. For instance, lack of usable toilets and absence of boundary walls were common problems.

Secondary schools seemed to fare better on infrastructure provisioning, but that was mostly on account of the older, non-RMSA schools included in the survey sample (31 of the total 62 schools surveyed) which were built by the state, primarily in the 1980s and 1990s (RMSA was launched in 2009). The most significant infrastructure gaps at the secondary school level seemed to be in the provisioning of boundary walls and computer labs. Interestingly, unlike SSA, there were significant variations across districts. For instance, while only 35% of all secondary schools in Surajpur and 58% in Bastar were found to have a separate and usable toilet for girls, such toilets were almost the norm in secondary schools surveyed in Janjgir Champa and Rajnandgaon (80-90% coverage).

Crucially, the schools were unable to fully exercise their right to demand provision of these facilities from relevant government departments. While there is provision for the School Management Committees or SMCs (primarily meant to represent parents) for making School Development Plans (SDP) – on the basis of which funds are released to schools – most SMC members are not trained in how to prepare these plans. In fact, they feel that developing an SDP is an exercise in futility as funds released are seldom in line with the needs of the school. This is often because the needs of each school are specific to its situation (which may depend on its location, geography, the local politics etc.) while the funds released by the government are often tied to the general perceived requirements of schools. At the same time, planning by government officials at the district level is done in an ad-hoc manner with little or no emphasis placed on the demands of the SDPs that are actually submitted to them.

Mid-Day Meal Scheme

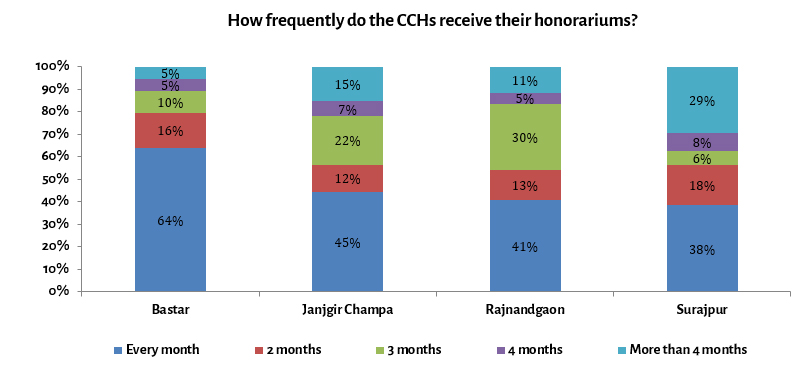
Innovation in delivering mid-day meals: Chhattisgarh has clearly innovated in delivering the MDM within the state. It has introduced an online system of rice provisioning to reduce the time taken to deliver rice to schools and decrease pilferage. The state has also involved local women in the cooking of meals and pays them a higher honorarium to increase their incentive to work.

Delays in receiving money: There are still, however, substantial delays in receiving cooking cost money and Cook-cum-Helper honorariums. These lead to women buying items like vegetables, pulses, oil etc. on credit, a system that is not sustainable. There are district-wide variations too – for instance, the district of Janjgir Champa appears to be performing poorly on most parameters. Given that it is a populous district with significantly more children enrolled per school, the shortfalls warrant attention.

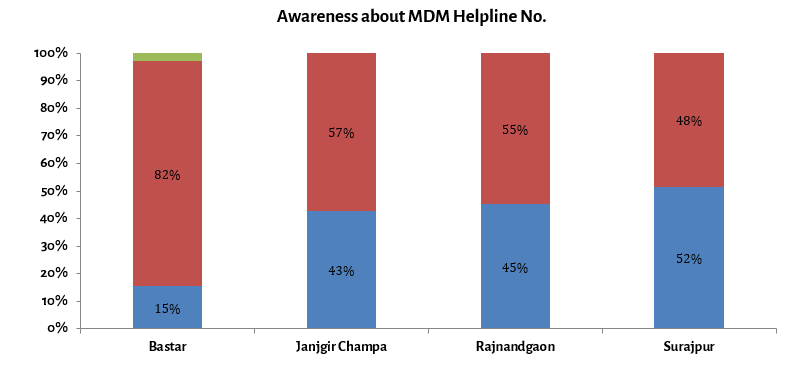
Moreover, official monitoring for MDM, which is closely linked with the overall monitoring of schools, is sparse. Monitoring visits by the last-mile points of government are not just few, but far between. Long distances and unavailability of public transport play some role in poor monitoring. MDM is often seen as an additional responsibility, warranting much vigilance, but with poor resources (both human and financial) being made available for keeping check. Existing mechanisms such as placing a complaint box in each school or providing MDM toll-free helpline numbers do not seem to work – not everyone seems to be aware of them.

Integrated Child Development Scheme

Infrastructure and equipment deficiencies: The survey conducted a census of the 240 anganwadi centres (AWC) present in the four districts. Serious deficiencies were found in infrastructure and equipment availability in anganwadis. The lack of usable toilets, equipment for cooking, essential drugs and material for health monitoring (such as child growth charts, immunisation charts, posters etc.), severely constrained anganwadi workers (AWW) and helpers

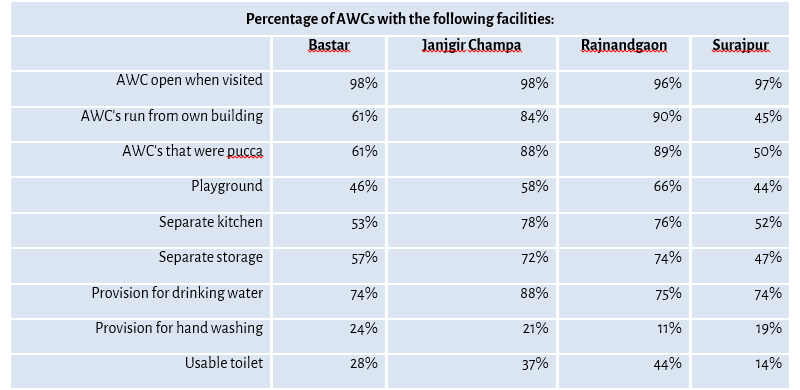
On a positive note, nearly all AWCs were found to be open when visited by the survey team. Attendance registers revealed that across districts, anganwadis were (on average) open for 26 days in the month prior to the survey, for 6 hours in a day (from 9/9.30 a.m. to 3/3.30 p.m.)

Overburdening anganwadi workers: The anganwadi workers have to also take on the role of being foot soldiers for delivery of multiple government schemes. This takes away from their focus on ICDS delivery, particularly the provision of pre-school education. In addition to their responsibilities at the anganwadi centre, AWWs and Sahayikas (anganwadi helpers or AWH) are drawn into delivery of social welfare programmes such as the Kishori Shakti Yojana (KSY) to educate teenage girls, and immunisation drives. They are also involved in other state work such as the Census and BPL (Below Poverty Line) surveys, enrollment for Aadhar, and so on. Additionally, to monitor delivery of ICDS and all services promised by it, they have to maintain a series of registers. For many of these activities, the AWW has to step out of the AWC, resulting thereby in noticeable absence, even though she is out for official work.

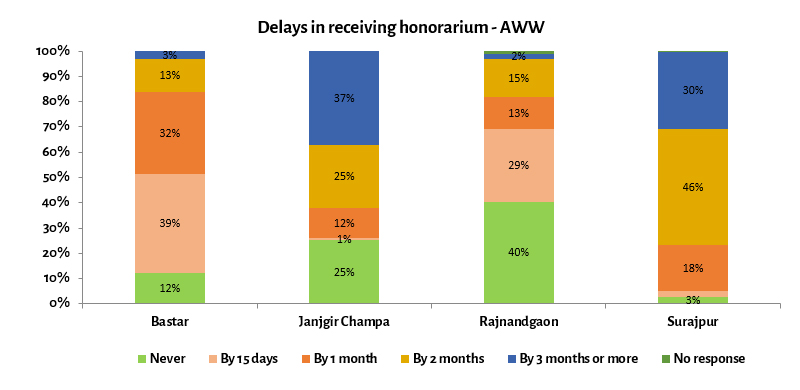
Moreover, the survey found substantial delays in the receipt of the honorarium for both the AWW and the AWH. These delays in honorariums may be explained by: (1) delays in release of funds out of budgeted allocation; and/or (2) low spending out of total ICDS allocation.

Conclusion

Administrative inefficiencies, poor targeting, high administrative costs and leakages characterise the implementation of many development programmes in India, and consequently, only a small fraction of development resources is said to reach their final destination. Although the problem is well-recognised, there is surprisingly little data or analysis in the public domain on how development funds travel through the system. It is often unclear what the systems and processes employed to implement state schemes are, and what their effectiveness in a given local context is.

This lack of understanding has an impact on public service delivery, which the study has sought to bridge. Chhattisgarh has taken a few steps to address some of the key concerns reported by the study. For instance, involving panchayats in selection of SHGs (Self Help Groups), implementation of civil works, and selection of teachers; having an online monitoring system to streamline grain allocation etc. These have already provided the state with the platform necessary for bringing about further improvements. Focusing on the small details of governance in this way can help the state bring about significant improvements in overall social sector delivery.

However, as per the AI study, these steps must critically be complemented by enhanced transparency in expenditure along with greater autonomy at the district-level. Key recommendations made in the report are as follows:

  • Improving public financial management in the state;
  • Empowering districts by providing block grants;
  • Balancing autonomy with bottom-up accountability;
  • Putting in place better data management systems and strengthening the ones that exist to enable better decision making by i) fixing roles and responsibilities clearly, and ii) strengthening capacity at lower levels.

The full report can be accessed here.

What are Countries Doing to Mitigate Climate Change?

DISCUSSION WITH AUTHORS OF THE UPCOMING 6TH ASSESSMENT REPORT OF THE INTERGOVERNMENTAL PANEL ON CLIMATE CHANGE
CLIMATE RESEARCH

On 1 October 2019, the Initiative on Climate, Energy and Environment (ICEE) at the Centre for Policy Research (CPR) and The Energy and Resources Institute (TERI) organised a discussion on climate policy and action with authors of the upcoming 6th Assessment Report of the Intergovernmental Panel on Climate Change (IPCC). This event was held in the backdrop of the second IPCC Lead Author Meeting for Working Group III (Mitigation of Climate Change), in which global experts met in Delhi to assess global progress toward reducing the rate of climate change.

The panelists included Fei Teng (Associate Professor and Deputy Director, Institute of Energy, Environment and Economy, Tsinghua University, China), Harald Winkler (Professor, University of Cape Town, South Africa), Heleen de Coninck (Associate Professor, Department of Environmental Science, Radboud University, The Netherlands), Karen Seto (Frederick C Hixon Professor of Geography and Urbanisation Science, Yale University, USA), and Roberto Schaeffer (Professor, Energy Economics, Universidade Federal do Rio de Janeiro, Brazil).

The conversation was moderated by Navroz K Dubash (Professor, CPR and Coordinator, ICEE) and Ritu Mathur (Senior Fellow, TERI).

About the Speakers

Fei Teng is Associate Professor and Deputy Director at the Institute of Energy, Environment, and Economy, Tsinghua University, and Lead Author (Chapter 17) for The Working Group III contribution to the IPCC Sixth Assessment Report. His research interests include energy and climate policy analysis using modeling tools, and the international climate regime.

Harald Winkler is Professor, University of Cape Town, and Coordinating Lead Author (Chapter 4) for The Working Group III contribution to the IPCC Sixth Assessment Report.

Heleen de Coninck is Associate Professor in innovation studies at the Environmental Science department at Radboud University, and Lead Author (Chapter 16) for The Working Group III contribution to the IPCC Sixth Assessment Report. Her research interests are international climate policy, energy technology and innovation. Before joining Radboud University, she worked for over 10 years at the Energy Research Centre of the Netherlands (ECN). She was one of the Coordinating Lead Authors of the IPCC Special Report on limiting warming to 1.5°C, which was published in 2018.

Karen Seto is the Frederick C Hixon Professor of Geography and Urbanisation Science at Yale University, and Coordinating Lead Author (Chapter 8) for The Working Group III contribution to the IPCC Sixth Assessment Report. She is one of the world’s leading experts on contemporary urbanisation and global change. Her research has generated insights on the links between urbanisation and land use, food systems, biodiversity, and climate change.

Roberto Schaeffer is Professor in Energy Economics at Universidade Federal do Rio de Janeiro, and Coordinating Lead Author (Chapter 3) for The Working Group III contribution to the IPCC Sixth Assessment Report. Dr Schaeffer’s main area of competence is in integrated assessment of climate change and coupled energy-economy climate modelling. In 2007, Dr Schaeffer was a co-recipient, with a number of scientists, of the 2007 Nobel Peace Prize for research contributions to the IPCC.

Navroz K Dubash – Professor, CPR, and Coordinating Lead Author (Chapter 13) for The Working Group III contribution to the Sixth Assessment Report. He is the editor of the forthcoming book, India in a Warming World: Integrating Climate Change and Development (Oxford University Press).

Ritu Mathur – Senior Fellow, TERI, and Lead Author (Chapter 4) for The Working Group III contribution to the Sixth Assessment Report. She heads the Centre for Integrated Assessment and Modeling at TERI, and her research focuses on examining and addressing the multiple connections between climate change, energy security and sustainable development.

Where is food inflation headed?

Price increases have been largely in imported items like edible oils and pulses. There is no generalized food inflation yet only because of subdued demand conditions.

Low inflation, particularly in food items, was a significant feature of the Narendra Modi government’s first term in office. Annual Consumer Price Index (CPI) inflation averaged 4.3% during that period from June 2014 to May 2019. It was even lower, at 3.3 %, for the Consumer Food Price Index (CFPI) inflation. There was also an extended period, from September 2016 to August 2019, when the CFPI inflation rate ruled below general CPI inflation in each of those 36 months.

The Modi government’s second term has been different by contrast. Between June 2019 and May 2021, average annual CPI inflation has been 5.7%, while even higher, at 7.4%, for CFPI inflation. The chart below captures these trends. In combination with retail prices of petrol, diesel and LPG rising since June 2019 – from Rs 71.73/litre, Rs 66.51/litre and Rs 712.5/cylinder to Rs 97.76, Rs 88.30 and Rs 809, respectively in Delhi – it is clear that both food and fuel inflation have returned (Just for comparison: On May 31, 2014, petrol retailed at Rs 71.41/litre, diesel at Rs 56.71/litre and LPG at Rs 414/cylinder).

Source: National Statistical Office.

Much of the above inflation is imported, which is most obvious in fuel. Between May 2020 and May 2021, the average price of crude oil imported by Indian refiners has more than doubled from $30.61 to $66.95 per barrel (Brent has since breached the $75/barrel psychological level). This has, however, also been exacerbated by the Modi government hiking the excise duty on petrol and diesel by Rs 13 and Rs 16/litre, respectively during March-May 2020.

In the case of food inflation, too, the fall during the Modi-1 period was substantially enabled by international prices. Between May 2014 and May 2019, the UN Food and Agriculture Organization’s (FAO) world Food Price Index (FPI) dropped from 121.3 to 94.2 points (base year 2014-16=100). The global FPI inflation rate, however, started climbing from October 2019. That was roughly when domestic CFPI inflation also crossed the 5% mark for the first time in over three years. Both global and domestic food inflation saw an uptrend till February 2020, before the novel coronavirus pandemic struck. There was a divergence thereafter. The FPI inflation crashed, even as CFPI inflation remained at near double digits till November.

India’s food inflation began easing with the harvesting of the post-monsoon kharif crop, interestingly, when a recovery in global food prices was gathering steam. The FAO-FPI inflation started soaring from around October, as demand returned with economies unlocking and restoration of supply chains taking time. Dry weather-induced production shortfalls in Brazil, Argentina, Ukraine, Thailand and even the US, along with Chinese stockpiling, added fuel to the fire. The FAO-FPI hit 127.1 points in May 2021, its highest level since September 2011. On the other hand, retail food inflation in India, even at 5% in May, was way below the corresponding global rate of close to 40% (see chart below).

Source: National Statistical Office and FAO.

The impact of surging global prices on domestic food inflation has been largely on commodities that India significantly imports. The country annually imports 13-15 million tonnes (mt) of edible oil and produces only 7.5-8.5 mt. In pulses, domestic output has gone up from 15-16 mt to 22-23 mt in the last five years. While imports have also halved to 2.5-3 mt, they do still exert considerable influence on domestic prices.

The table below shows that edible oil and pulses are the food items to have registered the highest price increase in the last one year. At the same time, cereals, sugar, milk and even staple vegetables (potato, onion and tomato) have recorded little or no inflation.

All-India Modal Retail Price (Rs/kg)

Year ago Current
Mustard oil 120 160
Soyabean oil 100 160
Sunflower oil 110 175
Groundnut oil 145 180
Palm oil 85 135
Chana dal 60 80
Tur/Arhar dal 95 110
Urad dal 100 110
Rice 28 30
Wheat 27 22
Milk 46 46
Sugar 40 40
Potato 25 20
Onion 20 25
Tomato 20 18

Source: Department of Consumer Affairs.

The reasons are two-fold. The first is that these are foods predominantly produced domestically. The good monsoons in 2019 and 2020 – India, Australia and Canada were the only top agricultural powerhouse countries that did not face serious weather-related issues – have ensured no supply shortages in their case. The second reason has to do with the collapse of demand from successive Covid-triggered lockdowns. With hotels, eateries, sweetmeat shops, hostels and canteens either shut or operating at low capacity, apart from no wedding receptions and other public functions, food demand has been confined mostly to households. Even household consumption has probably been affected because of incomes taking a hit from the reduction in overall economic activity.

Simply put, while food inflation has made a comeback in India, it is not yet generalized in terms of sustained across-the-board price increases, of the kind witnessed during the previous United Progressive Alliance regime’s second term from 2009-10 to 2013-14. As of now, inflation is only in imported food items.

There are three factors that would influence the course of food inflation in the coming months. The first is international prices. The FAO’s benchmark index is now at a near-decade-high. It must be noted, though, that the same index, only a year before (May 2020), had plunged to 91 points, its lowest in four years. Whether the current global price surge is a pointer to a renewed “commodity supercycle” or simply a result of temporary supply-side disruptions remains to be seen.

The table below shows that global prices of all major agricultural commodities have risen considerably over last year. But they have also fallen off their peaks, which were mainly reached in May and reflected in the FAO price index for that month. The decline from the peaks is visible especially in palm and soyabean oil. That should, in turn, have some salutary effect back home. Cooking oil is the one item that has been really on fire in recent months!

International agri-commodity prices

Unit Current Year ago Recent peak
Wheat Cents/bushel 652.00 485.75 761.75 (May 7)
Corn Cents/bushel 653.25 324.25 735.25 (May 7)
Soyabean Cents/bushel 1371.25 870.75 1642.50 (May 12)
Palm oil Ringgit/tonne 3421.00 2436.00 4506.00 (May 12)
Raw sugar Cents/pound 17.24 11.84 18.10 (May 11)
Coffee Cents/pound 153.40 97.80 162.35 (May 31)
Skim milk powder US$/tonne 3356.00 2609.00 3447.00 (May 18)
Cotton Cents/pound 94.95 68.00 98.50 (Feb 24)
Rubber US$/100 kg 204.40 152.50 272.40 (Oct 28)

Note: Wheat, corn and soyabean prices refer to the most actively-traded futures contracts at the Chicago Board of Trade. One bushel equals 27.2155 kg of soyabean and wheat and 25.40 kg of corn. Raw sugar and coffee prices are for the most actively-traded futures at the Intercontinental Exchange. Skim milk powder price is the average at the fortnightly Global Dairy Trade auctions. Crude palm oil price is for the most actively-traded futures at the Bursa Malaysia exchange.  Rubber price is for RSS-4 grade at Bangkok. Cotton price is the average based on the Cotlook ‘A’ index.

The second factor that will determine the outlook for food inflation in India is the monsoon. While the rains were 74% surplus in May, the southwest monsoon season (June-September) has itself so far recorded 26% above-average rainfall. These should induce higher kharif crop plantings that have already taken off. But since production is a function of both acreages and yields, a great deal rests on the rains during July-August, when the crop reaches the vegetative growth stage. 2019 and 2020 were excellent monsoon years. A third successive good monsoon should effectively put a lid on food inflation. That would be even more so if farmers expand acreages under oilseeds and pulses, which looks quite probable given the current market prices.

A third factor is the impact of fuel cost increases. The scope for their pass-through to consumers is today limited in an overall demand-constrained environment. Take milk. Dairies incur cost for its transport, first from the village collection centres to the processing plants that generally takes place in 2,000-3,000 litres mini-trucks. The milk that is pasteurized and packaged is further dispatched from the plants to the markets in bigger 10,000-15,000 litres tankers. Most dairies haven’t raised pouch milk prices, despite diesel costs going up by over Rs 15/litre in the last one year alone. What many of them have, however, done is reduce the prices paid to farmers. In Maharashtra, for instance, procurement prices of cow milk containing 3% fat and 8.5% solids-not-fat have fallen from Rs 31-32 per litre in February-March (pre-second wave) to Rs 21-25 now. In other words, the fuel pass-through has happened not by revising upwards the prices to consumers, but by lowering the prices paid to producers. In the event of a general growth and demand revival – whenever that happens – we could see processors, transporters and even farmers passing on the increase in fuel costs to consumers.

To the above three likely determinants, one may add a fourth, which is political. The Modi-1 administration’s tenure was marked by hawkishness on food inflation and privileging consumers over producers. During Modi-2, there has been focus on expanding minimum support price-based procurement, with new records in government purchases, particularly of wheat and paddy, getting established. Some of that has been prompted by the farmer protests against the Centre’s three agricultural reform laws.

The upcoming state elections in Uttar Pradesh might elicit similar political response in respect of sugarcane, where the minimum price payable to growers has hardly been revised during the four years of the Yogi Adityanath-led administration. How much of sugar price increase would the Modi government allow, in order to enable mills to pay more and on time to cane farmers? These are the kind of questions it may have to confront in other crops too, where the domestic supply-demand balance and international price environment are also more favourable to producers than a year ago.

Find all previous notes as part of the series here:

What is the implementation status of reservation for disadvantaged children in private unaided schools under RTE?

AMBRISH DONGRE AND HIS COLLABORATORS SHARE FINDINGS IN THE LATEST CO-AUTHORED STATE OF THE NATION REPORT
EDUCATION RIGHTS

Context

This report describes the status of implementation of the section 12(1)(c)of the Right of Children to Free and Compulsory Education (RTE) Act.

This section sets aside at least 25 per cent of the seats at entry level (pre-primary or grade 1) for children from economically weaker and disadvantaged sections of society at no cost to these children in: i) private unaided schools (non-minority) and, ii) special category schools.

The unaided schools that admit children through section 12(1)(c) are reimbursed a stipulated amount based on the comparison between actual amount charged by the school and recurring per student expenditure incurred by the government. This recurring expenditure is notified by the state governments from time to time, and is referred to as ‘notified costs’.

By mandating the inclusion of underprivileged children in private unaided schools, it acknowledges and challenges the existing hierarchies in access to education. Its effective implementation requires the government to create a system providing administrative, financial, and legal support.

What was the research about?

The report documents:

Procedural design of the admissions process and systems – especially online admission processes – followed in Gujarat, Karnataka, Madhya Pradesh, Maharashtra, and Rajasthan, as well as the initial implementation of online portals in Chhattisgarh and Uttar Pradesh;
Concerns and challenges faced by multiple stakeholders in relation to the online admission process;
Parents’ experiences of 12(1)(c) application process, and further experiences once the child is admitted to school through 12(1)(c);
Issues surrounding reimbursements to private schools that admit children under section 12(1)(c) and overall expenditure incurred for 12(1)(c) by the government;
Legal developments in relation to 12(1)(c).
How was the research conducted?

Information about admission processes was obtained from concerned officials in respective states. Attempts were also made to interact with parents who had applied through 12(1)(c); school administrators; and various non-governmental organisations and individuals who work in this space. Capturing parental experiences during the application process and once the child was admitted to a school through 12(1)(c) was the outcome of an extensive data collection exercise carried out in Ahmedabad. Additionally, budget documents were analysed to estimate per child expenditure on children in government schools while legal documents were scrutinised to understand the legal developments around section 12(1)(c).

Key findings

Non-implementation of 12(1)(c)

Out of 36 States and Union Territories (UT) in India, only 1 Union Territory and 11 States initiated action as evidenced by their seeking funds from the Central Government for implementation of this mandate, as the rules allow them to. These States include Chhattisgarh, Delhi, Gujarat, Jharkhand, Karnataka, Madhya Pradesh, Maharashtra, Odisha, Rajasthan, Tamil Nadu, Uttarakhand, and Uttar Pradesh. Despite more than five years of the RTE coming into force, more than half of the States/ UTs have not implemented this section.

Of the states that are implementing this mandate, a number of them implement section 12(1)(c) through a centralised online admission process (details given below).

Admission Processes

The report finds that the centralised admission process has improved administrative control and transparency in the admission process. However, the process, with its reliance on internet and absence of support structure, has also created access barriers.

The report describes experiences of applicants in Ahmedabad (Gujarat) where centralised online application process was implemented for the first time in admissions through section 12(1)(c) for the academic year 2017-18. Though the centralised online application potentially allows for a number of improvements over a paper-based system, the implementation of it highlighted many problems.

Lack of internet access, heavy reliance on cyber cafes and consequently higher expenses incurred for the application process, combined with problems faced by applicants in filling application forms were the direct fallout of the online process. In addition, complete absence of or inadequately equipped help-centres; lack of effective grievance redressal mechanisms; confusion around eligibility criteria; lack of synchronisation with admission cycle for seats, which are not reserved i.e. rest of the 75% seats exacerbated the complexity of the application process. Some of these problems were evident in other states as well.

The report offers a range of recommendations to improve this situation.

Lottery mechanisms

The report also compares the logic (of lottery) used for allotment of seats to applicants. Based on interviews with concerned officials from four states, the researchers found systematic differences in the logic used across these states. There were differences on accounts of public disclosure, ordering of applicants’ preferences for schools, and format of result declaration. For example, in some states (like Madhya Pradesh, Karnataka and Gujarat) applicants received allotment to only one school whereas in Maharashtra, an applicant could receive a confirmed allotment to multiple schools, of which one would be selected by the applicant. On the other hand, applicants in Rajasthan received priority numbers for each school applied.

Evidence from Ahmedabad based on a large scale survey

The report also presents findings from a child tracking study of over 1600 households in Ahmedabad.

The child-tracking study finds that although most eligible households are likely to apply if informed about the provision, information alone is insufficient to successfully navigate the various stages of the application and admission process. There are barriers in the form of transaction costs and information access, which prevent the more disadvantaged households from applying and receiving allotment of a seat. For example, many households need to procure documents such as caste certificates and income certificates for the process, which is both time consuming and costly.

More educated households and those with local language (Gujarati) as their mother tongue, which increases the access, may be at an advantage, as suggested by higher application and allotment rates of households with these characteristics.

Further, in a first attempt of this kind in the context of section 12(1)(c), the data shows that over 96% of those who had admitted their child through the policy in June, 2015 continued to attend the same school in December, 2016 (when the data was collected).

Once children are admitted to schools through 12(1)(c), preliminary findings suggest that fewer of them participate in extracurricular activities such as sports and cultural activities compared to those enrolled in private schools without the provision. Such challenges are a cause of concern and merit further exploration.

Issues around reimbursement

Analysis of budget documents reveals that there is discrepancy between notified per student reimbursement costs and actual per student expenditure by government as estimated by the researchers. Sources of this discrepancy are difficult to locate due to lack of clarity on how these notified costs are derived in the first place. Analysis, detailed in the report, also points to the possibility that most of the schools admitting children under 12(1)(c) are low cost/fee private schools. What that means for inclusion and learning needs to be analysed.

Legal Developments

The chapter on legal developments draws attention to issues related to Section 12(1)(c). The researchers find that while the courts have resisted efforts to narrow the eligibility criteria (like using the criteria of having a Below Poverty Line (BPL) card as the only way of identifying Economically Weaker Section (EWS) candidates), they have generally stayed away from ruling on administrative procedures like the mode of admissions. The courts have been particularly proactive with regard to ensuring the benefits of the mandate reach children with needs.

Way forward

The report makes specific and detailed recommendations on various aspects of the implementation of section 12(1)(c) such as clarity in rules regarding eligibility criteria; not relying exclusively on GPS for defining neighbourhoods; more time for application process; building a robust Management Information System to manage expenditure and reimbursement effectively; creative and informative communication campaigns; online and offline modes of application; timely and adequate reimbursements; and child tracking. More broadly though, the report calls upon government officials, judiciary, and private stakeholders for their active participation in ensuring effective implementation of 12(1)(c).

What Matters for Urban Women’s Work: A Deep Dive Into Falling Female Labour Force Participation

CHAPTER BY SHAMINDRA NATH ROY AND PARTHA MUKHOPADHYAY IN OXFAM INDIA’S REPORT ‘MIND THE GAP: THE STATE OF EMPLOYMENT IN INDIA’
ECONOMY

India is one of the lowest globally in terms of female labour force participation (FLFP), ranking only better than Pakistan in South Asia. While the decline in FLFP in rural areas is starkly visible, the urban FLFP has been consistently low since the 1980s despite higher economic growth and increasing level of education among females. The economic offset created by such low FLFP is huge and if, for instance, it (16.8%) could be raised to the level of FLFP in China (61.5%)[1], it has the potential to raise India’s GDP up to 27%. This chapter attempts to investigate the structural deficiencies behind this consistently low urban FLFP through a variety of perspectives, ranging from measuring the complexity of women’s work to the implications of caste, location and family structure. It finds factors like presence of female-friendly industries, provision of regular salaried jobs and policies that cater to women’s needs to work near home like availability of part-time work, can improve the situation, though prejudices arising from patriarchy require to be addressed to make these measures truly transformative and not palliative.

[1] This is from the International Labour Organisation (ILO) model estimate for 15+ population in the World Development Indicators of the World Bank, 2018.

The full chapter in the report can be accessed here.

Who Becomes a Slum Leader in Urban India?

A TALK BY TARIQ THACHIL
URBAN GOVERNANCE

Listen to a talk (above) by Thariq Thachil, Peter Strauss Assistant Professor of Political Science at Yale University where he presents the findings from his paper ‘Who Becomes a Slum Leader in Urban India?’

The talk describes the results and inferences from a study conducted by Adam Auerbach and Tariq Thachil that investigates the role of political brokers in the slums of two Indian cities. The study, based on an extensive survey experiment with 2,199 residents across 110 slum settlements in Jaipur and Bhopal, broadly found that slum leaders emerge through bottom-up selection by slum residents.

What is happening beyond large cities? Understanding census towns in India

PART 2 OF A SERIES OF INTERPRETATIONS DRAWING ON A NEW BOOK ON SMALL TOWNS


Kanhu Charan Pradhan from CPR, who was among the first scholars to highlight the specific role of Census Towns in the 2001-2011 period, draws on his earlier research to explain the role of census towns in understanding the pattern of urbanisation in India.

How is the ‘urban’ defined in India?

The definition of what is ‘urban’ in India is relatively complex. The UN ‘Demographic Yearbook 2005’, which compiles the various ways in which urban is defined across the world shows that the Indian definition is unique to the country. All urban areas in India can be broadly classified into three groups on the basis of their manner of governance.

  • The first type includes all urban areas that are established under a law, whether it is a state or a central law. These urban areas have a pre-defined structure of urban governance and they are known as ‘statutory towns’ (STs). They are governed by urban local bodies.The STs can be further divided into three groups depending on the nature of laws under which they were established. ‘Cantonment boards’ in India come under the central government and were established under The Cantonment Act, 2006. Urban local bodies were given constitutional status under the 74th amendment to the Constitution of India. States define specific criteria for categorising various types of municipalities, and these often differ from one state to another. Overall, ‘Municipal Corporations’ are instituted for large cities while ‘Municipalities’ cover smaller urban settlements, and ‘Nagar Panchayats’ are set up for transitional areas. However, a particular place can be excluded from the purview of municipalities, if a state decides to declare that area as ‘industrial township’ under an appropriate state law.
  • The second type of urban areas are known as ‘census towns’ (CTs). They are identified by the Registrar General of India (RGI) as a result of the population census exercise. CTs include all villages which satisfy the three predefined conditions of population size (at least 5,000), population density (at least 400 people/sq. km.) and non-farm workforce (at least 75% of male workforce). However, CTs continue to be governed as villages, and are part of Panchayats, which were given constitutional status under the 73rd amendment to the Constitution of India.
  • The third type of urban areas, which are neither STs nor CTs are ‘out growths’ (OGs). These include all settlements or partial settlements that always lie near a ST but outside its statutory limits. Here, the test is whether these areas possess urban infrastructure and amenities, not whether they satisfy criteria on population size, density and economic activity, like the CTs. The OGs, like CTs, are governed as rural areas.

What are the main challenges of the identification methodology of census towns or CTs?

It is important to note that the RGI finalises the rural/urban classification before the census actually happens. This is because the census schedules are different for rural and urban areas. However, there are three main challenges in the methodology used to identify CTs.

  • Firstly, it considers all STs as urban before the census is conducted. Then it identifies CTs using the previous census data. It uses a population cut-off of 4,000 in the previous census, instead of 5,000, with the working assumption that these places will have reached 5,000 people in one decade. But it requires the settlements to cross the thresholds of density (400 people/sq. km.) and non-farm work (75%), in the previous census. Due to the difference in the expected and actual population growth, some of the CTs which are classified as CTs do not satisfy some or all conditions. On the other hand, some villages, which actually satisfy these conditions are not identified as CTs. In addition, levels of non-farm work can reduce from one census to another.
  • The second problem is related to the use of one common definition for such a large and diverse country. For instance, the settlement pattern in India is very different from state to state. The average size of villages in the hilly states is relatively much smaller than plain states. Similarly, the population growth varies greatly across space.
  • The third challenge is related to the sensitivity of the definition itself. To briefly explain, if we reduce the population cut-off by 500 (3,500 people instead of 4,000 people), then 40 million more rural population in 2011 would be eligible to be classified urban in the coming census. Similarly, a reduction of 5 percentage points in the workforce criteria implies that 18 million additional rural people would be classified as urban. Researchers have also tried other methods to define urban; such as on the basis of commuting distance (Uchida and Nelson) and contiguous built-up area (Denis and Marius-Gnanou).

How did the debate on census towns start and what is the debate about?

CTs are not new in India. The RGI is classifying settlements as CTs since the 1961 census. I got interested in the subject due to the high increase in the number of CTs in Kerala combined with a high urban population growth. When I found out that almost all the urban population growth in Kerala was explained by the new CTs, I expanded that work. This work was one of the first published papers on CTs in Economic and Political Weekly. The findings of the paper, which showed, inter alia, that one third of the urban population growth during 2001 and 2011 was due to new CTs generated more interest among researchers, and the steep increase in the number of CTs from 1362 in 2001 to 3892 in 2011 was highlighted in newspapers. Some even questioned whether the large increase in the number of CTs was an attempt to inflate the extent of urbanisation. Over time, it has modified our vision of an urbanisation driven only by large cities and opened new debates on topics, such as: how are these CTs spread across India? Are the economic structures and the access to amenities in these CTs different from villages of a similar size? What are the governance challenges of CTs? And, most importantly, what is happening beyond large cities?
Are census towns evenly spread across the country? Are there any other important characteristics you want to highlight?

The concentration of CTs is disproportionately high in few states. West Bengal (780) had the maximum number of CTs in 2011, followed by Kerala (461), Tamil Nadu (376) and Maharashtra (278). Almost the entire growth in urban population in Kerala between 2001 and 2011 was due to additional CTs.  This share was also very high in West Bengal.

In terms of their distribution across districts, on an average, the highly urbanised districts and their neighboring districts have a higher number of CTs. It implies that many CTs lie close to existing urban areas. Using different straight line distances according to the size of STs, we found that 42% of the total CTs were close to class-I towns (population greater than 100,000).

The remaining 57% CTs which were not proximate to any class-I STs can further be divided into two separate groups.  The ‘clustered’ CTs are not close to Class-I towns but lie close to other CTs or a smaller ST. The remaining CTs, that we can call ‘isolated’ CTs are standalone CTs, and often lie in strategic locations such as in major industrial units or near a national highway or road junction. Of the remaining 57% non-proximate CTs, 68% fall in the first category and 32% fall in the second category. Figure-1 shows a schematic picture of the three different types of CTs.

You have mentioned that the RGI uses the last census data to identify census towns. Is it possible then to predict the number of census towns for the upcoming census?

Yes. It is possible to broadly predict the number of CTs for the 2021 census, but there are few caveats.

First, the RGI includes plantation, livestock, forestry, fisheries and allied activities as farm activity in the CT estimation, but the census data that is publicly released combines them with the non-farm workforce. It requires some adjustment as these sectors are heavily concentrated in some districts (like tea gardens in Assam, fisheries in Kerala etc.). Consequently, the final result depends on the way this adjustment is done.

Second, there are some settlements which might be identified as CTs using the 2011 census data, but may merge into the existing cities or convert to new towns or STs during this period. It is difficult to predict the magnitude of this phenomenon. With these caveats in mind, our estimate suggests that 2149 CTs may come up in the upcoming 2021 census and the broad regional distribution of these CTs would be similar to the existing ones.
You have insisted on the importance of non-farm workforce to define census town. Since the share of non-farm work force is going up, can we expect more census towns in coming years?

It is true that the share of the non-farm work force, on an average, is increasing over time. Hence one would expect more CTs in future. But the process is much more complex than it seems and one should not ignore the dynamics at the micro level. It is not true that the non-farm share is increasing in all settlements. More importantly, Sidhwani (2014) has shown that this process is not uni-directional: many villages do indeed show a decreasing share in the non-farm workforce and some of them are large villages. The amount of research focused on understanding such processes is limited and hence the actual reasons behind these processes are unclear. So, classifying a village as a CT and then again reclassifying it back to a village is not unprecedented. Further, the increase in non-farm work force is not necessarily associated with the expansion of formal employment but is more often due to increase in casual employment in the non-farm sector.
The central government last year asked state governments to convert all census towns into statutory towns. What is your reaction to that move?

I don’t think converting all CTs into STs is the right approach. It should be done on a case by case basis. As I have already mentioned, in India, it is the state government, which decides on the creation of new STs and the minimum criteria is not uniform across states. The minimum population criteria for the smallest type of municipalities ranges from 5,000 (Punjab) to 30,000 (West Bengal). So, unless states use their prerogative power or combine settlements to achieve that population threshold, it is unlikely to convert all CTs into STs. It is instructive to remember that in the last decade only 42 new STs were created.

Further, I have highlighted different types of CTs. Conversion of CTs into STs could be useful for planned governance of some of the CTs, in particular, for some of the larger ones. However, the applicability of this particular mechanism to all CTs is very doubtful and it should be done on a case by case basis. For example, if a CT is in the periphery of a large city, merging the CT into the city could be more helpful. Similarly, if multiple CTs lie close to each other, they can be combined together to make a larger ST.

The other piece in the series can be accessed below:

What do Bihar voters want?

NOTES FROM THE FIELD
ELECTION STUDIES POLITICS

Neelanjan Sircar, Ashish Ranjan and Bhanu Joshi share their notes from the field based on extensive travel across Bihar to get a sense of how voters are making up their minds.

A spate of contradictory opinion polls and an aggressive campaign between bitter foes, Nitish Kumar and Narendra Modi, and bonhomie between once bitter foes, Nitish Kumar and Lalu Prasad Yadav, have only served to confuse the situation further in the state.

They have focused on constituencies that went to the polls in the first two phases of the election, and tried to tease out what ‘vikas’ means for the people, and how caste influences their decision.

Read the full field notes here: What do voters want?

‘The Hindu’ carried a shorter piece on 28 October: It’s not about caste or beef, but vikas

Warrior of an Unfinished Agenda: Remembering the late KC Sivaramakrishnan

A TRIBUTE BY BHANU JOSHI ON HIS FIRST DEATH ANNIVERSARY
OBITUARIES

Kallidaikurichi Chidambarakrishnan Sivaramakrishnan died on 28th May 2015. On his first death anniversary, Bhanu Joshi remembers him.

What is the institutional architecture within which we foresee India’s urbanisation? What framework of governance – public or private do we think would be able to provide better services to the urban India?

Kallidaikurichi Chidambarakrishnan Sivaramakrishnan or KCS, as many of us called him, was amongst the first to ask and continued engaging with this question over his lifetime. Chief Executive of the Calcutta Metropolitan Development Authority, and secretary in both the Ministry of Urban Development and the Ministry of Commerce, Professor and chairman of the Centre for Policy Research, he was one of the pioneering interpreters of urbanisation in modern India.

A man whose commentary and work ranged from delimitation to the environment and climate change, from Ganga water management to South Asian cooperation, KCS was most valued for his contribution to understanding decentralisation in India. He was involved in the making of the watershed 65th Constitutional Bill, which later became the 74th Constitutional Amendment (CAA). The longest amendment to the Constitution of India, it was the 74th CAA, which mandated the creation of municipalities across urban areas.

Perspectives and Approaches

The numerous books, journal and popular writing on decentralised urban governance by KCS employed three concomitant perspectives – historical, legal and political.

He assigned a great importance to historical continuities in his analysis. For him, India’s modern conception of devolution had an antecedent in the nineteenth-century colonial rule. While colonial local self-government provided a forum for representation and practice, it was the provincial, state and central legislatures which controlled their powers, finances and functions. As KCS writes, “In the struggle for independence, urban growth was viewed usually in the frame of large metropolitan or industrial cities and all the want, squalor, slum growth and the blight they presented.”[i] Post-independence, the local government remained a lesser form of government with similar control exhibited by the centre and the state.[ii]

The second perspective was the defining of institutional powers and legislative domains of local governments, produced by the coalescence of law and legal jurisprudence. Although judgements delivered by High Courts and the Supreme Court were central to many of his own arguments; in many of his writings, he was critical of the views taken by the Courts.[iii] He believed, there were limits to which adjudication in the Courts of Law can help the process. Besides, “Courts prefer to dwell upon the letter of the law, rather than the spirit, however relevant it may be for a proper understanding and interpretation of the law. The remedy may not lie in the Court, but elsewhere.”[iv] That ‘elsewhere,’ lay in the polity and the process of people’s participation. He believed, that India’s decentralisation project cannot bypass the messiness of politics and people’s participation.[v] It is a genuine participative process, which is deeply contested that brings a strong and powerful elected government responsible for its successes and failures.

The Question of Governance

KCS were Secretary in the Ministry of Urban Development, when the 65th Constitutional Amendment Bill was brought to the Lok Sabha by the Rajiv Gandhi government. The 74th CAA, modelled on the Bill drafted earlier, opened up avenues of political participation by creating a new political class in big and small cities in India. “We thought we were on the cusp of a revolution,”[vi] said KCS in a public lecture in 2012. The optimism created made it clear that at the local level the elected representatives were going to demand an increasing share in the political domain. “As this demand turns more vocal and insistent, changes in the legal and administrative base of the Nagarpalikas will become inevitable.”[vii]

Twenty years later, the tides changed and there was a recognition that the 74th CAA though path breaking, remained a restrictive framework. His work on the metropolitan regions in India is revealing on the imaginative restrictions imposed by the Amendment. Referring to the metropolitan regions in India; an entity like the Mumbai Metropolitan region comprising of areas beyond the city corporation, to include both rural and urban, multi-municipal and non-municipal bodies, he argued that, metropolitan governance cannot be compartmentalised as rural or urban but there has to be strong intra-municipal coordination, inclusion of the rural local governments and a direct link between the various state and central ministries and the region. The idea that the problems of a ‘big’ city (and hence the region) are of, and restricted to, that city alone is flawed. Transport, water supply, garbage disposal, planned development are not city centred and extends beyond and have to consider the region as a whole. The “74th constitutional amendment of 1993 has failed to visualise the dynamics of large, complex urban formations,”[viii] he surmised. In his last published chapter, he is less charitable, “notwithstanding the initial objectives of enlarging the funnel of participation and providing for a wider system of directly elected representative bodies, in actual effect the amendment has failed to fulfil this objective.”[ix]

And here, then, lies the biggest contribution of KCS. By grappling with the question of the institutional architecture of urban governance, he posed profound questions on how should our cities grow. His body of scholarship leaves a reference point for us to ask – who should head our cities and what structures – elected or unelected should plan for our city? What forms of people’s participation do we imagine for our cities?

Within the wide canvas of indulging the urban, there has been a growth; positively so, on understanding the various facets of the subject. Housing, migration, economic geography, role of land, issues of livelihoods, urban systems, provision of services to urban populations especially the urban poor, urban violence and exclusion, and urban infrastructure have been investigated with great detail. Indeed, these studies provide a lens to subjects hitherto unexplored. Yet, the core question of urban governance, on which arguably, many of these are not only contingent but are greatly affected, has received limited attention over the years. Understandably, the term ‘urban governance’ is not homogenous, and cannot be thought to be panacea for all things bad. However, understanding and advocating greater autonomy to the city, a politically accountable leadership and an inclusive city government which becomes the forum for planning the city are the backbone on which exigencies of urban systems, livelihoods, service delivery tilt on.

His Legacy

In the summer of 2014, KCS was appointed the Chairman of the “Expert Committee on the New Capital for Andhra Pradesh” by the Ministry of Home Affairs. As the Committee was about to depart on a weeklong trip of the newly carved state, KCS mentioned his deteriorating health condition and a no travel dictum issued by the doctors. Nonetheless, constant updates were taken from the members even at wee hours and a few visits were made to Hyderabad. Notwithstanding a jump in his medical regime, the Committee submitted its report much before the deadline.

The report of the committee left the decision to the political leadership of Andhra Pradesh, reaffirming his fundamental belief that in a democracy it is the people who matter. He believed, that a democracy will come to terms not by an orderly progress of law but only by creating platforms where battle will be fought contests would be held. It is in a question, which KCS posed to a gathering in Mumbai that offers a peek into his legacy; “Before you think of becoming Shanghai, shouldn’t Mumbai start thinking of becoming Mumbai first? Like everywhere else, we can lay the contours of battle – It is that much easy for us to promulgate victory then join the battle. The reason why I am spending so much time is because I think we are capable, we shouldn’t be sterile. We need to think out of the box.”

[i] Sivaramakrishnan, KC (1978), Indian Urban Scene, (Shimla, Indian Institute of Advanced Studies), 106.

[ii] Lecture delivered by KC Sivaramakrishnan on ‘Devolution and Urban Development’, (February 23, 2012) part of the Golden Jubilee Lectures on Governance, India International Centre available on http://www.iicdelhi.in/webcasts/view_webcast/golden-jubilee-lectures-on-governance-/ last accessed on 28th May 2016.

[iii] See, generally, Sivaramakrishnan, KC (2010), ‘Judicial Setback for Panchayats and Local Bodies’, Economic & Political Weekly XLV (32): 43-46.

[iv] Sivaramakrishnan, KC (2009), Courts, Panchayats & Nagarpalikas, (New Delhi, Academic Foundation), 257-270, 329.

[v] See, generally, Sivaramakrishnan, KC (2006), People’s Participation in Urban Governance (ed.), (New Delhi, Institute of Social Sciences), 38-51.

[vi] Lecture delivered by KC Sivaramakrishnan on ‘Devolution and Urban Development’, (February 23, 2012) part of the Golden Jubilee Lectures on Governance, India International Centre, Delhi, available on http://www.iicdelhi.in/webcasts/view_webcast/golden-jubilee-lectures-on-governance-/; last accessed on 28th May 2016.

[vii] Sivaramakrishnan, KC (2000), Power to the People, (New Delhi, Konark Publishers), 228-229.

[viii] Sivaramakrishnan, KC (2013), ‘Revisiting the 74th Constitutional Amendment for Better Metropolitan Governance’, Economic & Political Weekly, 48(13): 86-94.

[ix] Sivaramakrishnan, KC (2016), ‘Local Government”, in Sujit Choudhry, Madhav Khosla, and Pratap Bhanu Mehta (eds), The Oxford Handbook of The Indian Constitution, (Oxford University Press), 578.

[x] Lecture delivered by KC Sivaramakrishnan on ‘India’s Mega Cities: Prospects and Challenges’, (March 15, 2012), Observers Research Foundation, Mumbai, available on https://www.youtube.com/watch?v=0JqG_jH5WaM ; last accessed on 28th May 2016.

Waste and air pollution: Panel on 7 March 2018

HIGHLIGHTS FROM THE PANEL DISCUSSION HELD AS PART OF THE CLEARING THE AIR SEMINAR SERIES
AIR POLLUTION ENVIRONMENTAL JUSTICE

On 7 March 2018, the Initiative on Climate, Energy and Environment (ICEE) at the Centre for Policy Research (CPR) organized a panel discussion on ‘Municipal Solid Waste as a cause of Air Pollution’ as part of the ongoing Clearing the Air? Seminar Series on Delhi’s Air Pollution. The panelists were Ravi Agarwal, founder director of Toxics Link, Nalini Shekhar, co–founder of Hasiru Dala, and Dr Seema Awasthi, founder and director of ICUC Consultants Pvt. Ltd., and the panel was moderated by Arkaja Singh, Fellow, Centre for Policy Research.

The panel discussed some of the best practices on waste disposal that can help reduce exposure to airborne toxins from municipal solid waste. Some of the strategies suggested give primacy to waste workers, whereas others emphasize on technology, infrastructure and management.

We have identified some important points that came up during the panel discussion and presented them in the form of a Q&A below. Videos of the panel discussion and the power point presentations made by the speakers can be accessed here.

What are the locations and kinds of exposures to various kinds of pollutants, particularly air borne pollutants that take place in the total disposal cycle of solid waste?
Ravi Agarwal (RA): The IIT-Kanpur report (Sharma and Dixit, 2016) attributes 8-9% to open burning of municipal solid waste as a source of PM10 and PM2.5. Waste is a very complex material which emits a cocktail of pollutants including harmful gases other than the classic pollutants and the regularly monitored PM10 and PM2.5. However, most of them are not accounted for due to the complexity of the waste stream. Dioxin is a highly toxic chemical pollutant generated from incinerators. While worldwide there are incineration standards, in India, despite very high dioxin exposure with serious health implications, there have been till recently no regulations for emission of dioxins. There are several dispersed sources of air pollutants from waste which are also not yet measured.

Most regulations are aimed at the end of the pipe emissions, undermining the complexity of the waste stream and the potential of pollution from each stage of the waste disposal cycle.

Seema Awasthi (SA): Nearly 35 million tons of carbon dioxide equivalent of greenhouse gases like methane are estimated to be produced from dumpsites annually worldwide (as per the data from the International Solid Waste Association in 2015) The effluent gases from open waste burning include smoke, black carbon and other toxic fumes with low levels of dioxins and furans.

What are the pollution standards and regulations that govern waste disposal? Do they adequately consider the risk of air pollution? What are the main loopholes in the current regulatory and governance system?
RA: The existing standards are technological standards pertaining to the end of the pipe emissions reduction in the waste cycle. The new MSW Rules of 2016 acknowledged the need to formulate standards at each step in the complex waste stream. It is also the first time that the incineration standards were incorporated into the rules. However, there is a lack of will to support campaigns like that create awareness about the environmental dangers of open burning of waste.

The Sukhdev Vihar/ Okhla Timarpur incinerator is the one where a project with high capital investment was permitted without any environmental approvals.

A research document ‘Be careful with that cure’ by Toxics Link on dioxins emissions from medical waste incineration led to the change in incineration owing to cost of standards for dioxins. The Biomedical Waste Rules were formulated in 1998, and these were subsequently amended in 2016. This is also probably the only incineration law in the world that still prohibits the incineration of chlorinated waste across different waste categories.

Formulating environmental standards is easy. But to acquire skills and equipment, and attain a high quality regulatory system requires capacity building on the ground which is missing in the Indian scenario. For example, there is a 0.1 ng TEQ (nanogram Toxic Equivalents) limit on dioxin and furans but there is no ability to comply with it in India. Furthermore, in India, importance is given to waste disposal rather than reducing airborne emissions. There is a rush to install high cost technologies without adequate understanding of their regulatory or operation ecosystems. Decisions on using the technology for managing waste need to be based on logical assessment of the suitability of the proposed technology in terms of deriving the best cost to benefit ratio. High end, expensive technologies are often promoted by the business lobby. For example, plasma technology was proposed for waste to energy generation by a company in Gujarat that managed to get the standards for this technology incorporated in the 2016 MSW rules. However, plasma is a very high end technology, and internationally is used for destruction of chemical weapons. Its usability for MSW management in India is doubtful.

Standard making is a semi political, semi science based process and is also not always linked with health data; but is often designed on the basis of what is perceived to be achievable. There is no credible primary study on actual emissions from waste or their impacts on health.

SA: According to the 2016 MSW Rules, door to door management system should be in place that ensures collection of segregated waste. The responsibility to collect waste segregated as dry waste, wet waste and domestic hazardous waste (including sanitary waste etc.) lies with the Urban Local Bodies (ULBs). As per the 2016 Rules, the bulk generators have to manage the waste they generate, whereas the city government is concerned with the waste generated by the households and small commercial units. The waste collectors/pickers transport the waste to the primary collection point. In big cities, the waste is further compacted in transfer stations or is transported to a processing facility. As per the rules, organic waste or waste with high calorific value should not be dumped or disposed.

Funds for installation of required infrastructure for waste management have been provided under the Swachh Bharat Mission. However, the challenge remains in sustainable operation of the projects and generation of funds for operation and maintenance by the city governments.

What are the main technologies and approaches for dealing with municipal solid waste?
SA: The philosophy of 3Rs – Reduce, Reuse and Recycle – is an efficient way to manage waste. Segregation implies more efficient waste management which reduces the amount of waste reaching landfills; thereby reducing the amount of waste that may have to be incinerated, leading to reductions in emissions. Another method is ‘Zero landfilling’ which aims at processing all the waste before it reaches the landfill. This concept also helps in addressing the issue of paucity of land for landfill sites in growing cities.

Rules prohibit the dumping of organic waste with high calorific into the landfill site. Biomethanation is a viable technical solution for processing such organic waste. Various technologies for incineration can be applied for dry waste and mixed waste. Refuse derived fuel (RDF) method is used for dry and wet waste where the waste is segregated, dried and made into pellets which are then used as fuel.

The JNNURM promoted windrow composting as a method of efficient management of organic waste. The compost generated from most of the windrow composting plants, however, failed to meet the standards of compost that could be used for agricultural purposes. Hence, the smaller cities are now encouraged to use segregate wet waste for composting. For large cities, currently, waste-to-energy options are being promoted mainly because they enable handling large quantities of waste in smaller areas, reducing volume significantly, generating only 15-20% of rejects in the form of ash and inerts. Simultaneously, we get energy as the end product for which the Government of India provides subsidy to help make the project finacially viable.

Biomining with scientific closure is an option being explored to manage the huge quantities of waste lying in the open dumpsites in almost every city of the country. Through biomining, one can segregate and recover useful material lying within the big waste mounds, thereby reducing waste footprint, resulting in reclamation of land that could be used for construction of scientifc landfill or waste processing facility. However, biomining is an expensive process and can only be adopted by those municipalities which have adequate capital for setting-up the required infrastructure.

50% of Bangalore households are now segregating their waste. How has this come about? What has been the role of the city authorities, and the waste workers, both formal and informal, in achieving this?
Nalini Shekhar: The informal waste pickers working with Hasirudala are filling the gap by providing a waste management system, which the local government could not provide. With the help of the waste pickers, 1050 tonnes of waste is being managed, which is resulting in saving 84 crore rupees per annum for the city. The waste pickers are recognized as extremely skilled labor and in Bangalore city they have been issued identity cards with the city logo and signature of the municipal commissioner, on the initiative of Hasirudala. ‘No burning of waste’ campaign of Hasirudala was the first campaign centered around the role of waste pickers. Bangalore is the first city to have a MoU with the waste pickers. Around 80% of the city’s waste is no longer burnt by the waste pickers.

Hasirudala has managed to involve the government. The Bruhat Bengaluru Mahanagara Palike (BBMP) helped in setting up of nearly 180 dry waste collection centers in about two years. Every ward now has a dry waste collection center for non organic waste. All these dry waste collection centers are managed by waste pickers. Dry waste is collected twice a week in every ward with the help of waste pickers. Further, the waste pickers are given work orders in their name to collect dry waste, while the wet/organic waste is collected by contractors.

The three-way waste collection, i.e., dry waste, wet waste and sanitary waste, was also initiated in Bangalore with the help of waste pickers. The separate category of sanitary waste came into being in 2017 with the intervention of Hasirudala. It is considered as municipal solid waste while being collected, and is considered as biomedical waste for disposal.

Reduction of waste is also important and Karnataka is the first state to pass a legislation banning one time use plastic. Waste workers showed readiness to give up on making more money out of more waste collected at the cost of public health. The ban has only been successful due to citizen participation.

The reject waste collected from households has reduced from 310 g per household per day to 95 g due to better segregation of waste. This was the initiative of the for-profit HasiruDala Innovation Pvt Ltd catering to 33,000 households a day. The waste pickers are not only recognized as skilled labour force but are also seen as entrepreneurs and Hasirudala’s interventions have targeted their innovation skills in all its programs.

What are the challenges concerning location and maintenance of landfill sites? What are the possible solutions to saturated landfill sites?
SA: The issue of solid waste management has become so pertinent in the present times because the quantum of waste generated has increased tremendously. Limited land and resource availability with the municipalities makes waste management a challenge in big cities. It is also an issue with smaller cities which lack the resources and infrastructure for efficient waste management.

In our country, only 70% of the total waste is collected and only 20% of the total waste generated is treated. The remaining 80% finds its way to the landfill (Planning Commission, Govt. of India. 2014). Nearly 90% of the population in South Asia does not have access to waste collection and disposal, as per the data from the International Solid Waste Association in 2015.

Landfill fires are a big cause of concern as they are a source of air pollution. Decomposition of organic waste, in the absence of oxygen, generates methane and carbon dioxide. Methane has a high calorific value and makes the landfill site vulnerable accidental fires. High temperature and pressure conditions are also conducive for starting a fire within a landfill. Burning of waste to reduce its quantum is also sometimes the only option for smaller cities with inadequate infrastructure for waste processing.

According to the Rules, the waste rich in organic contentment, recyclable waste and dry waste with high calorific content should not reach the landfill sites and has to be recycled or processed to a useful end product. In the case of saturated dumpsite, the dumpsite should be properly closed following the prescribed scientific procedure.

In scientifically operated landfill sites, the excavated space is covered with an impervious liner to prevent groundwater pollution and the waste, strictly the rejects, is covered daily with 15 cm soil layer after being dumped. After the landfill is full to its capacity, it is closed with an impervious liner (clay, HTPE etc) followed by soil cover and green grass cover. However, due to the lack of resources the standard procedure is not followed. The Gorai site in Mumbai is the only site where a landfill site has not only been successfully closed but the CDM credits are being used for managing the project.