CLEARING THE AIR: MONTHLY COLUMN IN THE HINDUSTAN TIMES BY NAVROZ K DUBASH
POLITICS CLIMATE CHANGE
In the sixth instalment of a monthly op-ed series in the Hindustan Times entitled ‘Clearing the Air,’ Professor Navroz K Dubash explores two equally true, but fundamentally different, ways of understanding climate change in India in light of the recent UN Climate Action Summit.
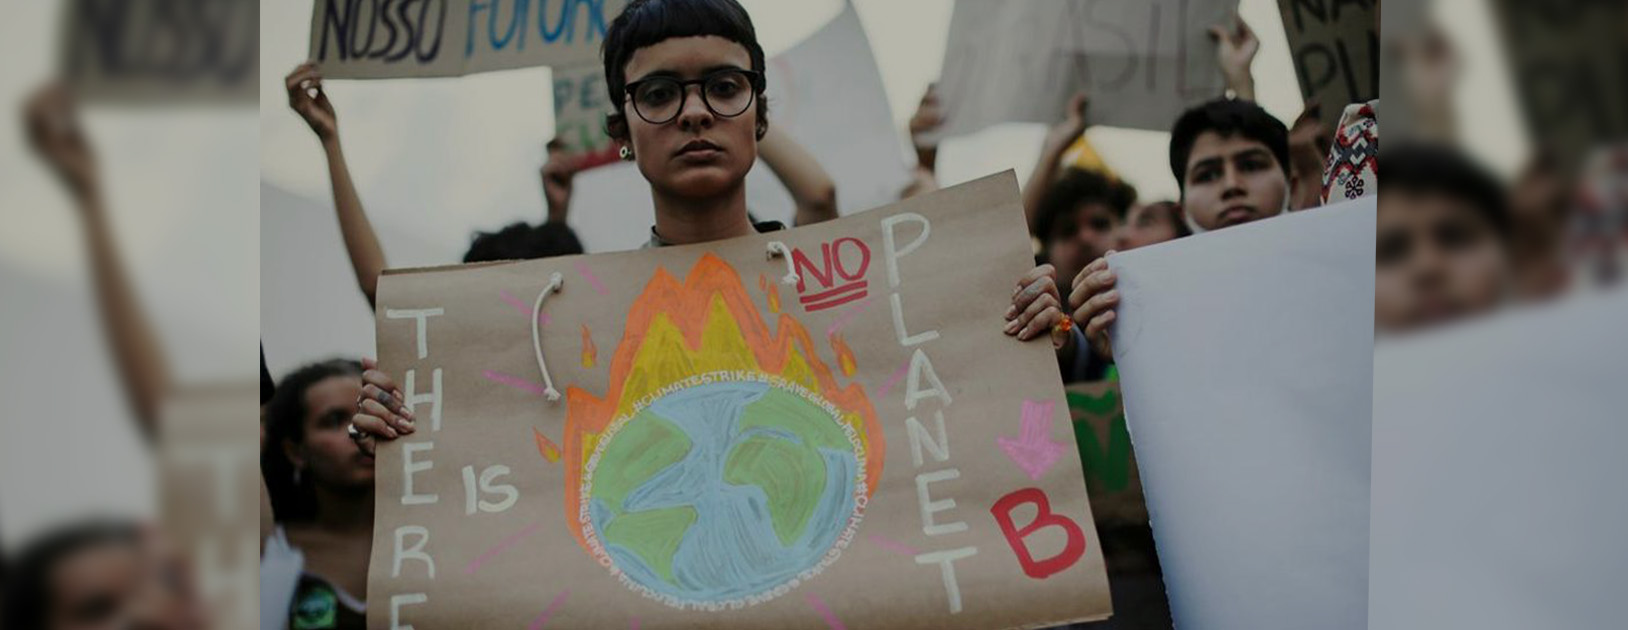
The enduring image of the United Nations (UN) Climate Action Summit held on September 23 is the young climate activist, Greta Thunberg. “How dare you continue to look away?”, she demanded, invoking wide-scale suffering, collapsing ecosystems, and the beginning of a mass extinction due to climate change.
Thunberg and burgeoning groups of other climate activists are responding to a drumroll of news of a destabilised global climate. According to the scientific report submitted to the UN, the last five years are on track to be the warmest ever recorded; higher carbon dioxide has made the ocean 26% more acidic; the four lowest levels of winter sea-ice were recorded in the last five years; and heatwaves and cyclones have become more common and more deadly. A short list of implications for humanity is greater food insecurity in the face of heat, drought, and declining crop yields; greater exposure to heatwaves causing illness and decreased productivity; and decreases in GDP, particularly for poorer and warmer countries. None of this accounts for the risk of catastrophic climate change, which could happen if certain tipping points are reached.
Faced with this growing science and growing pressure from the street, the UN secretary general called for leaders to come to the summit with far-reaching plans, not speeches.
What he, and we, got was, for the most part, slightly warmed-over policies. A few countries pledged to reach net-zero carbon by 2050, a bold stretch. Many others, including India, reiterated that they will meet their Paris Agreement pledges, sometimes with a few teasers thrown in (such as India’s statement we would increase renewable energy to 450GW, but with no date, and an intriguing proposal for a coalition on disaster resilient infrastructure). A sizeable minority, including the United States, Brazil, Japan and Australia, were simply no-shows. Thunberg is right: We are looking away.
Beneath this failure to act sit two equally true, but different, ways of understanding the climate problem.
The first is that climate change is an existential problem that threatens life on earth and ecosystems, and requires extraordinary measures. And the evidence is mounting that business as usual measures — an energy saving light bulb here, a few percentage points more renewable energy there — are not going to solve the problem. The UN secretary general is informed by this view when he calls on all countries to halve their greenhouse gas emissions by 2030 and go to net zero by 2050. Implicit in this view is that everyone needs to act with urgency.
By contrast, the second, closer to India’s historical view, is that while action is needed, agreeing on which countries need to act and how much — how to divide the carbon pie — is equally important. From this perspective, understandably, it is outrageous to ask a country like India, whose citizens use less than a tenth the amount of electricity on average than an American, to take equivalently strong measures to address climate change. From this perspective, climate existentialism is threatening, as it ramps up the pressure for poorer countries to take on equivalent obligations to richer countries, which may risk short-circuiting future development by curtailing energy use.
The tension between the two perspectives is heightened by the rise of nationalism in several countries. That the US, historically the largest emitter, is unwinding its domestic climate policies on the basis of tenuous arguments about its economic competitiveness lends weight to those concerned about how the pie will be divided.
When the governments of major countries like Brazil also express scepticism about climate change, it further lowers the incentive to act. This explains the lukewarm statements by India and China that they are fulfilling their existing pledges, and this should be quite enough. These divided perspectives place India in a particularly difficult place. As a poor country deeply vulnerable to climate change, we should be in the climate existentialism camp. But as a country with considerable future energy needs, we vociferously stress that the carbon pie has to be divided equitably.
In the meantime, India, as with most other countries, continues with business as usual policies. We add renewable energy, but also look to sign oil and gas contracts and attract investment in coal. In this, we are not dissimilar to other countries. But neither are we leaders. Reconciling climate existentialism and the fair division of the carbon pie is not easy. But it is not clear that India is really seeking the answer. Like everyone else, we, too, are looking away.
Navroz K Dubash is a Professor at the Centre for Policy Research. This is the sixth article in a monthly op-ed series in the Hindustan Times entitled ‘Clearing the Air.’ The original article, which was posted on September 25, 2019, can be found here.
Read more in the Clearing the Air series:
India needs environmental governance
Green industrial policy is a timely idea for India to explore
Our clean air plan is a missed chance
Can India grow now and clean up later? No, it can’t
How to Avoid the Middle Income Trap
SHIBANI GHOSH DECONSTRUCTS THE EAC’S RECENT DECISION
ENVIRONMENTAL JUSTICE RIGHTS ENERGY RESEARCH
The Expert Appraisal Committee (EAC) for River Valley and Hydroelectric Projects of the Environment Ministry decided during its meeting held on 30 December, 2016, that it would not take cognisance of representations received from civil society groups during the final appraisal of a project proposal for grant of environmental clearance.
The minutes of the meeting recorded that many of these representations have ‘an anti-development attitude so that the projects are kept on hold or delayed. This has financial implications to the developers in particular and to the nation in general’. The EAC was of the opinion that once it was satisfied that the public consultation stage had been satisfactorily completed, receiving representations would mean reopening the process.
Recommendations of EACs, expert committees appointed by the Environment Ministry (currently there are 8 such committees), play a crucial role in the Ministry’s decision to clear a developmental/infrastructure project, and hence this latest decision raises a slew of questions, especially from the perspective of the civil society participation in the environmental clearance process.
In the interview below, we deconstruct what this move means in conversation with environmental lawyer and Fellow at CPR, Shibani Ghosh.
How does the latest decision of the Expert Appraisal Committee (EAC) of not entertaining ‘anti-development’ civil society representations reflect on the EAC?
The EACs’ primary role in the environmental clearance (EC) process is to give recommendations to the Ministry of Environment, Forest and Climate Change (MoEFCC) on project proposals after considering the potential impacts of the project. Based on these recommendations, the MoEFCC either rejects the proposal or grants a clearance with conditions which would mitigate the impacts or compensate for the same.
The decision of the EAC for River Valley and Hydroelectric Projects is problematic for at least three reasons:
First, the EACs perform a very important role in the EC process, and their independence and objectivity are as crucial as the expertise they are expected to bring to the table. There are several design flaws in the EC process, one of the most critical being that the environmental impact assessment (EIA) of the proposed project is paid for by the project proponent. As substantial information about the project and its potential impacts are provided by the project proponent, its accuracy, the assumptions made, and safeguards proposed require independent verification. However, from the minutes, it appears that the EAC for River Valley and Hydroelectric Projects has a bias against civil society groups, which also include project-affected persons, who are important stakeholders in the EC process. They may raise objections, provide alternative assessments, and highlight inaccuracies or falsities in the project proponent’s submissions. The EACs needs to keep an open mind to all stakeholders’ opinions.
Second, according to the EIA Notification 2006, the MoEFCC has to communicate all public responses to a proposed project it receives to the EACs. It is not supposed to assess the content of these representations or determine their appropriateness. That is the EACs’ function. If the EACs find that public representations are repetitive, do not raise new issues or are unsubstantiated, they have the discretion not to consider them, but they cannot delegate this function to the MoEFCC.
Third, EAC members are appointed because of their expertise and experience in areas relating to environmental impact assessment and environmental protection. Their role in the process is to provide an expert opinion on a proposed project, its impacts and possible mitigative measures to the MoEFCC. The financial implications of the process or any delay in approving a project should not be a relevant consideration for the EACs. Their neutrality is compromised if they sympathise with one stakeholder (the developer) but refuse to hear concerns of other stakeholders (the public).
What is the process of getting an Environmental Clearance? What kinds of projects require one?
The Central Government issued a Notification under the Environment (Protection) Act 1986 on 14 September, 2006 requiring certain categories of projects to obtain an EC prior to commencing any project work. This Notification is popularly referred to as the EIA Notification 2006 as EIA studies form an important part of the EC process.
The categories of projects that require a prior EC, listed in the Schedule to the EIA Notification, include thermal power projects, river valley power/irrigation projects, mining, industries, airports, highways, solid waste management projects, etc. Depending on the size and capacity of these projects, the EC is either sought from the MoEFCC or from the State Environment Impact Assessment Authority (SEIAA), which is constituted by the Central Government in each state for this purpose.
The EC process begins with the project proponent submitting an application with relevant information about the proposed project to the relevant regulatory authority (the MoEFCC or the SEIAA). The next stage is the issuance of detailed and comprehensive Terms of Reference (ToRs) for the preparation of an EIA report by the project proponent. The EACs may intervene to amend standardised ToRs to address specific issues with regard to particular projects.
The draft EIA report prepared by the project proponent, based on the ToRs and other relevant documents, is then made available in the public domain (offices of local and regional authorities and official websites) for public consultation. Certain projects are exempt from the public consultation process, and these are listed in the EIA Notification. The outcome of the public consultation is sent to the project proponent who is expected to respond to the material concerns raised and finalise the draft EIA report.
The final EIA report, the outcome of the public consultation (including minutes and video recording of the hearing), and other relevant documents are then appraised by an EAC. The EAC is expected to undertake a detailed scrutiny of the documents and the project proponent’s presentation, and then recommend the proposal for grant (or rejection) of EC or recommend additional studies before making a final decision. Based on the EAC’s recommendations, the MoEFCC issues its final decision. The MoEFCC normally accepts these recommendations, but it could disagree and ask the EAC to reconsider its recommendations.
Why is public participation important in the EC process? How is civil society usually involved in the EC process, especially through the EAC?
Public participation is crucial in environmental decision making processes as it introduces a greater degree of legitimacy, transparency and accountability in the process and thus makes the outcome more acceptable. In the EC process, public consultation is important for at least three reasons:
First, it is only through the public consultation process that people can try to understand the actual nature of the proposed project and the extent of its potential impacts.
Second, persons likely to be affected, directly or indirectly, by a proposed project must have an opportunity to express their opinion and challenge the assumptions and assurances about the project, the nature and extent of its potential impacts, and the proposed safeguards.
Third, as the EIA studies for proposed projects are commissioned by project proponents, the comprehensiveness and accuracy of these studies need to be verified. The public can point out inaccuracies, inadequacies and misrepresentations in the studies either from their personal experience or knowledge of the area, or by relying on alternative assessments and studies by experts.
Public participation in the EC process is primarily during, but not limited to, the public consultation process. The public consultation process has two components: (1) public hearing/s held at the project site or in its close proximity to ascertain concerns of people; and (2) written responses from those with a plausible stake in the environmental aspects of the project. The public could continue to engage with the process later as well by writing to the relevant EAC and highlighting specific concerns. They may do so because: they were not effectively heard earlier; they have accessed material previously unavailable; or as the EAC has limited time to deliberate, public representations could draw the EAC’s attention to specific concerns.
Only the draft EIA report is available before the public consultation. The project proponent, while responding to material concerns raised during the public consultation¸ is supposed to finalise the EIA report. But the public does not get an opportunity to access the final EIA report and verify whether its concerns have been taken into account. It is the EAC which is expected to be the neutral arbiter with expertise to assess whether the public’s concerns have been adequately accounted for in the final project proposal. In the event that the project is being recommended for the clearance, the EAC has to include adequate mitigative or ameliorative measures in its recommendations, some of which may be required to assuage the public’s concerns.
What are the ramifications of the decision by the EAC of not considering public representations in the EC process?
The EAC’s decision is indeed very unfortunate, as the members are experts appointed to consider environmental and social ramifications of projects, and not the financial implications caused as a result of properly considering such ramifications. The ToRs of the EACs are silent on whether they can consider public representations sent to members directly or those sent after the formal public consultation stage is completed.
Till date EACs have been accepting these representations. In fact, previously the EAC for thermal and coal mining projects has expressed its concern that it was not getting enough time to consider the serious issues raised in the public representations as it was receiving them very late. Noting that it could not deny anyone the right to voice their concern, the EAC requested the MoEFCC to consider issuing guidelines that would require all stakeholders to submit objections at least a week before the EAC meeting.
In another meeting, the EAC decided that the project proponent had to respond to these public representations before the next EAC meeting, so that the EAC could consider the project proponent’s response and the MoEFCC comments on the response. It is clear that the EAC considered these public representations as valuable in its decision making process.
As the appointing agency, the MoEFCC could ask the EAC to reconsider its decision, or itself revise the EAC’s ToR to specifically require it to consider public representations. But neither may happen as the Environment Minister has reportedly told these experts that they should clear projects fast, and not compromise on ease of doing business.
NEW BLOG SERIES BY ACCOUNTABILITY INITIATIVE
HEALTH
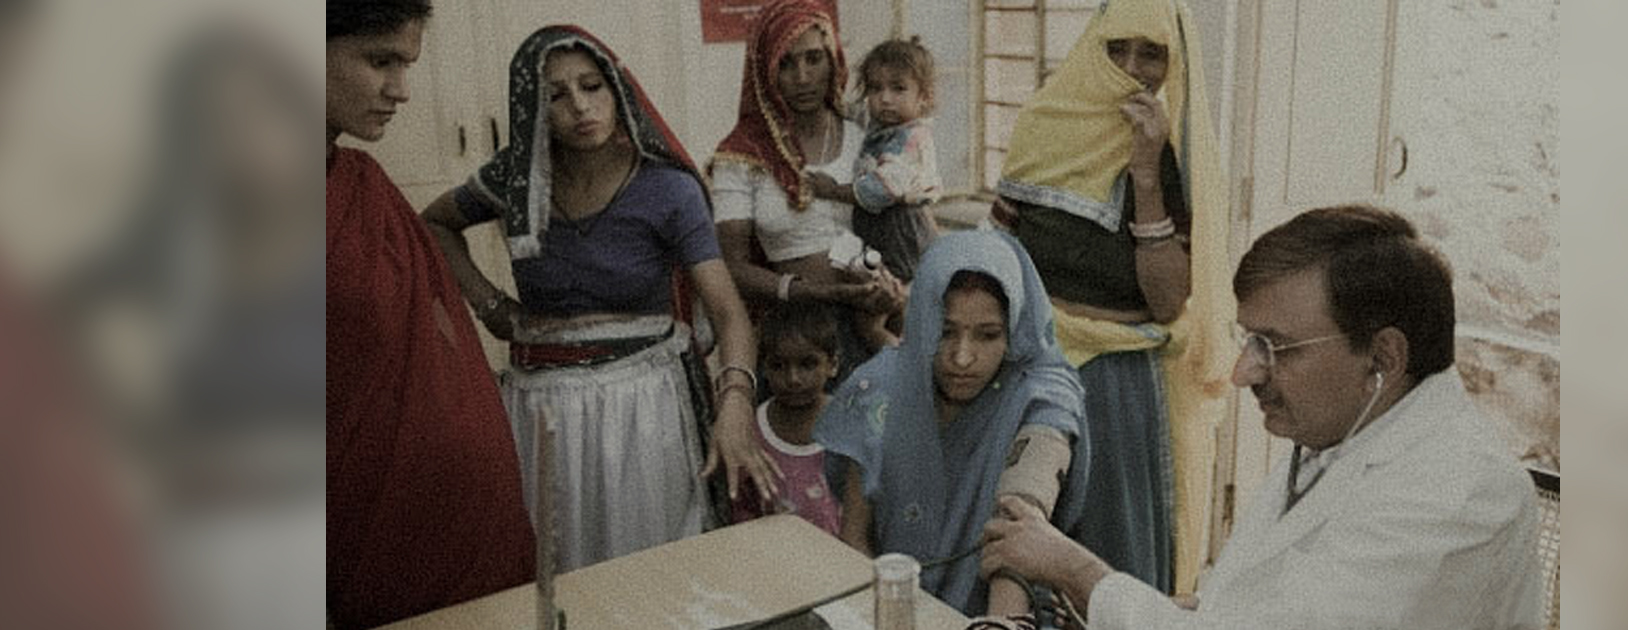
Using data, this series analyses some areas where India’s public health system remains weak. What emerges is a stark picture of how government funding is yet to keep pace with challenges to service delivery of government healthcare providers.
India’s Stunted Progress On Child Health looks at the status of child malnutrition. Even today, Anganwadi Centres do not cover all children who require nutrition services: only 1 in 2 children received any service according to official data. A quarter of Integrated Child Development Services (ICDS) beneficiaries are malnourished, a number that has increased from 15 per cent in 2015 to 25 per cent in 2017, as per analysis by the Accountability Initiative. This shows that even as ICDS coverage is expanding to include those who need it most, malnutrition remains a problem among those that avail ICDS services.
The next blog unpacks the changing nature of disease profile in adults. Approximately 4 in 10 people in the country are outside the ‘normal’ range: 2 out of 10 are thin, and 2 out of 10 are overweight. A shift in the disease burden to non-communicable diseases comes against the backdrop of more people accessing private healthcare options due to an already weak public health system. These options are far costlier than government healthcare, and a large number of people have to shell out huge amounts of money, which pushes people further into poverty.
The final blog understands the current priorities of government spending and how it is disconnected from the realities of health and poverty. Given the increase in non-communicable diseases, specialists (surgeons, physicians, gynaecologists, and obstetricians) will be required with even greater urgency. As many as 6 out of 10 deaths in India are now a consequence of non-communicable diseases. The average hospitalisation cost in a private hospital is almost 4 times that of a public hospital in rural areas, and a little more than 4 times for urban areas. Meanwhile, funding for the National Health Mission (NHM), the Government of India’s largest health programme, has remained largely immobile from 2013-14 to 2016-17.
PART 8 OF A BLOG SERIES BY THE CENTRE FOR POLICY RESEARCH (CPR) AND PRAYAS (ENERGY GROUP)
ENERGY RESEARCH
The series is titled ‘Plugging in: Electricity consumption in Indian Homes’.
When and how do people use different household appliances in a day? This is an important question for electricity distribution companies that supply the electricity required to run these appliances. For instance, if the use of air-conditioners shoots up on a particularly hot summer afternoon, then the distribution company will have to buy additional electricity to meet the demand at that particular time. An equally important consideration for utilities and households is the electricity consumption of appliances in actual operating conditions, compared to the manufacturers’ claims made under laboratory conditions. In this post, we look at broad appliance usage patterns observed in India and briefly discuss new work on measuring the actual use of electricity in households.
Households’ use of appliances depends on a number of factors such as income, climate, and behavioural tendencies, among others. There is limited understanding of the household level use of different appliances in India and its variation across socio-economic conditions and geography. Studies that project India’s residential electricity consumption assume nation-wide, uniform usage hours based on few local load research studies. There is a wide variation between these usage hours’ assumptions as seen in Figure 1.
Figure 1: Compilation of usage hours of appliances from different studies
Source: Prayas (Energy Group), Residential Electricity Consumption in India: What do we know? December 2016
The load research studies estimate appliance usage patterns based on household surveys and load analysis of residential feeders. The Bureau of Energy Efficiency (BEE) under its capacity building programme commissioned about 30 such load research studies for public sector distribution companies all over India in 2015. However, these reports are not yet public, and a better understanding of appliance ownership and usage remains partial.
While surveys provide relatively low cost means to gather insights into various aspects like appliance ownership and purchase patterns, accuracy of information on actual electricity consumption can be limited. This is because of two key reasons: (a) respondents may have difficulty in recalling the actual use of appliances; and (b) the actual power consumption of appliances may be different from the rated power consumption claimed by the manufacturer. In order to address this gap, we have initiated a project to install metering devices in a sample of households to measure electricity consumption every minute and send the data to a central server. These devices will measure the aggregate household electricity consumption and consumption from selected key appliances. We have started with Pune and will eventually extend to other urban, semi-urban, and rural areas in India. Daily (anonymous) consumption patterns recorded by these meters will be periodically updated on a publically accessible website. The project builds on our existing electricity supply monitoring initiative which measures and publishes the quality of electricity supply in about 300 locations across the country.
We briefly describe insights based on initial data recorded from selected households in Pune below.
People use different appliances at different times of the day. Load curves of households show the variation of electricity drawn by the household from the grid over the length of the day. Electricity distribution companies prefer a flatter load curve as it eases their supply operations. However, appliances like the air-conditioner, electric water-heater, and microwave oven can add significant peak demand. As the ownership of these appliances increase, it will be crucial for the distribution companies to understand the cumulative impact of their use on the load curve. Figure 2 shows the difference between the load curve of a household owning basic appliances and the load curve of a household owning high power appliances. Basic appliances include lighting, fans, and the refrigerator and high power appliances include an additional air-conditioner, electric-water heater and microwave oven.
Figure 2: Comparison of load curves between households with basic appliances with high power appliances like air-conditioner, electric water-heater, and microwave oven, in addition to basic appliances.
Source: Data recorded by Prayas, Energy Group
Refrigerators accounted for about 25% to 50% of the total electricity consumption of the selected households. This may change in the summer when ceiling fans, air-coolers and air-conditioners are used more. We found a significant variation in the actual electricity consumption of the refrigerators across homes. One 15-year old refrigerator consumed 4 times more electricity than a 3-year old 5-star refrigerator of same type and size. On an annual basis, this can mean the old refrigerator consumes about 1200 units (kWh) of electricity (contributing to the electricity bill with Rs. 6000-7000) compared to 300 units (about Rs. 1500-1800) by the new, efficient refrigerator. Load curves of both refrigerators (Figure 3) throw more light on this. The compressor, which consumes most of the electricity, is always on in the old refrigerator while it draws less power and periodically switches off in the new refrigerator, thus consuming less electricity. This may be because of the usage habits (frequent opening of the refrigerator door) or deteriorated performance of the working parts of the refrigerator.
Figure 3: Load curves for refrigerators
Source: Data recorded by Prayas, Energy Group
Such insights can be useful across different stakeholder groups. They help distribution utilities understand the cumulative impact of high power appliances like air-conditioners and electric water-heaters on the load curve. Actual consumption data from a sample of appliances can also be used to design campaigns that highlight the magnitude of real impacts of energy efficiency on consumer electricity bills. The BEE, which is responsible for running the Standards and Labeling (S&L) programme, can use the data to modify the procedures and ratings to represent the actual consumption of appliances more accurately. Finally, manufacturers can use the data to understand the performance of their products under actual operating conditions.
In the next, final, post of this series, we examine the role of behavior in how appliances are used.
The post is authored by Aditya Chunekar at Prayas (Energy Group), Pune.
This blog series is also available on the Prayas website here.
To subscribe to email updates on the series, click here.
Other posts in this series:
Electricity Consumption in Indian Homes
Trends in India’s Residential Electricity Consumption
India’s LED Lighting Story
Illuminating Affordable Homes
The Efficiency of Appliances
Appliances used in Affordable Housing
Electrifying the National Capital Region
Role of human behaviour in driving electricity use
EMPLOYMENT JOURNEYS IN SEMARANG REGENCY, INDONESIA
URBAN ECONOMY MIGRATION
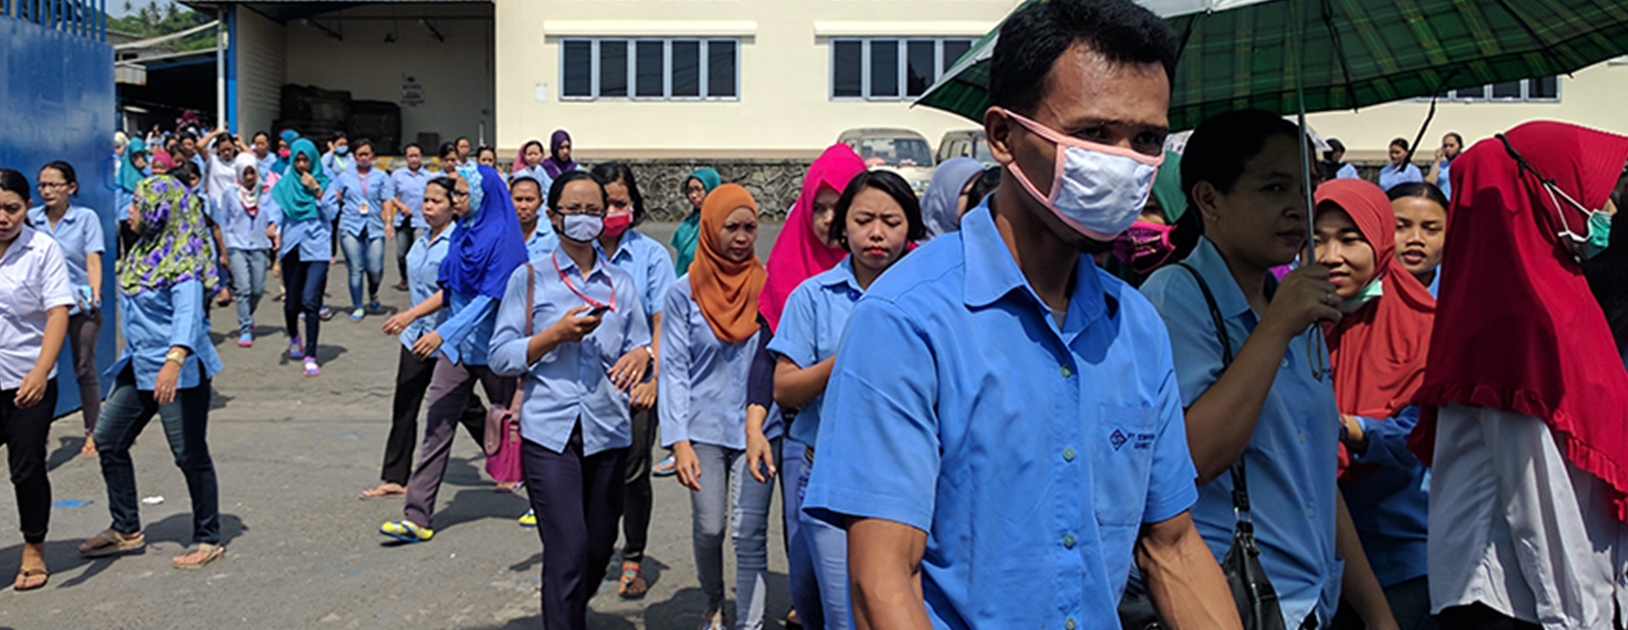
The Centre for Policy Research in collaboration with Just Jobs Network is investigating youth employment and migration patterns in small cities in India and Indonesia, two Asian countries that seek to leverage urbanisation to reap the demographic dividend. This piece explores trends from surveys and qualitative enquiries conducted in Semarang Regency in Central Java, Indonesia, where factory work has been the default employment for men, and large numbers of women, for decades but is no longer the long-term aspiration for young workers.
Advocates, workers’ organizations and scholars have long pointed to the contingent and short-term nature of work in labor-intensive manufacturing sectors like garments and food processing, where large firms often rely on young workers – especially women – to power their factories. However, less attention has been given to a set of related concerns: To what extent do young people aspire to life-long industrial jobs, independent of pay or working conditions? And what work do they do once they’ve left the factory?
Qualitative interviews with young migrants in the industrial areas south of Semarang – a port city in Central Java – speak to these questions and offer important insights about the factors that shape the employment journeys of young people in 21st century emerging economies. The data was collected as part of an ongoing project of JustJobs Network, in collaboration with the Centre for Policy Research in New Delhi, which seeks to understand the employment and migration experiences of young people in non-metropolitan urban geographies in India and Indonesia.
We find that youth in the industrial cluster of Semarang Regency have complex working lives that reflect the dynamic interplay of the formal and informal economy. Moreover, young industrial workers tend to see factory jobs as only one stage in the course of an entire employment journey.
Consistent with earlier scholarship, we find that youth working in the area’s garment factories tend to see factory work as offering limited opportunities for wage growth, skill development and economic mobility. Beyond this, however, many factory workers express an interest in starting their own businesses, placing high value on the independence they would gain through self-employment – even if it means earning less. In fact, a common phenomenon among older migrants who were interviewed is the “usaha sampingan” – or side business – which many imagine will eventually be their primary form of employment, after they leave their factory jobs.
This observation gives rise to two different insights. First, it suggests that young people use the capital they accumulate in factory work to invest in their own enterprises later in their working lives. And second, it illustrates that young workers’ early exit from factory jobs is driven by both push factors – such as the contingent nature of contracts and constrained wage growth – and pull factors – young people’s aspirations for something more than an assembly line job. Women in particular value the independence of entrepreneurship, which gives them the flexibility they need to take on care work.
Another interesting finding of our work in Semarang Regency regards the dynamic relationships between the formal and informal economy, and the way former factory workers’ enterprises promote these linkages. Some of the businesses that workers start after leaving factory work are directly tied to the skills they learned on the job. For example, we met an entrepreneur who buys scraps of fabric from local factories and weaves rugs, dishcloths and other textile products from them.
In other cases, former factory workers establish businesses that cater to current factory workers, relying on tacit knowledge of their social and economic needs. For example, we met a man running a boarding house and motorbike parking lot next to a major garment factory. He migrated for a job at the same factory and left it after a period of years to set up his enterprise across the road. Many other types of service providers similarly co-locate with large factories – like laundry services, repair shops, mobile phone recharge kiosks, and food stalls. The purchasing power of factory workers is significant: in our survey, respondents estimated their monthly budget for leisure and entertainment at IDR 300,000 (US$ 22), around 20 percent of their wages.
What are the policy implications of these insights? The first relates to the target populations for entrepreneurship programs. As a 2014 JustJobs Network study indicated, entrepreneurship policies in countries like Indonesia tend to target unemployed and underemployed young people who may have no option beyond starting a micro-business. These sorts of interventions miss the possibility of giving factory workers like those in Semarang Regency the tools they need to build businesses once they enter a new stage of their working lives. Moreover, while current policies tend to promote “survival” entrepreneurship, a different strategy – focused on harnessing the education, skills, work experience, capital as well as tacit knowledge and social networks of entrepreneur ex-factory workers – may be more successful in generating growth-oriented small and medium-sized enterprises. Such businesses will do more to address the major job creation challenge facing emerging economies like Indonesia than sole proprietorships.
Second, the trend our research reveals in Indonesia suggests that policymakers may need to adopt a different approach to informality. While a job’s formality is often used as a proxy for its quality – with labor market reforms reflexively oriented toward formalization – the active choice of some workers to move from the formal to the informal economy implies that formal and informal jobs may suit different needs at different stages in a worker’s employment journey. Smaller, self- and family-owned enterprises, which today largely operate in the informal economy, have certain qualities that appeal to workers.
This means two things: (1) Governments ought to consider long-term, fiscally sustainable approaches to creating strong safety nets for informal economy workers and entrepreneurs; along these lines. Indonesia’s recently rolled out universal health and employment insurance – BPJS – is a step in the right direction. And (2) The effort to formalize must be seen as a flexible, incremental process, one that enables small, everyday enterprises to thrive rather than squeezing them out of the economy in favor of large industrial outfits like those employing garment workers in Semarang. The relationship between these two types of firms is complementary – not only for the economy but for the individual worker over the course of her employment journey.
Authored by Gregory Randolph
Reproduced with permission from the JustJobs Network blog.
DISCUSSING NON-DETENTION AND CONTINUOUS COMPREHENSIVE EVALUATION (CCE)
EDUCATION
As Union MHRD minister Smriti Irani and the Delhi state government signalled their intention to reverse the no-detention clause of the Right to Education Act (RTE), CPR along with partners organized a seminar on the issue.
The first of a series, the seminar on 30th April debated the provisions of non-detention and Continuous Comprehensive Evaluation (CCE) in the RTE Act of 2009. A range of stakeholders, including educationists, teachers, researchers, government officials, and parents discussed whether failing students could solve the problem of low learning levels. They agreed that to raise learning levels, systemic issues such as shortage of trained teachers and good resource materials had to be addressed instead.
Watch the full recording of this important and interesting discussion above—a first step towards a much-needed informed public discussion on the issue.
AS PART OF ‘POLICY CHALLENGES – 2019-2024: THE BIG POLICY QUESTIONS FOR THE NEW GOVERNMENT AND POSSIBLE PATHWAYS’
CPR ECONOMY IDENTITY DISCRIMINATION
By Neelanjan Sircar
According to the International Labour Organization, female labour force participation in India dropped from 35% in 1990 to 27% in 2014.1 The gender gap in labour force participation in 2014 was 53 percentage points,2 and urban female labour force participation in India has all but stagnated for the last two decades.3
This has occurred in a context of rising per capita income – which accelerated in India from the 1990s onward – and a significant reduction in fertility rates. Indeed, standard economic theory predicts that as countries move from lower income to middle income (as India is doing), women leave the workforce as there is less need to engage in the most arduous forms of labour – such as agriculture and brick kilns – for a bit of extra money. As incomes rise sufficiently, it is argued that women are offered white-collar jobs and re-enter the labour force – as in the West.
But India’s numbers are far worse than what standard theories predict. A recent World Bank report found that the country is ranked 121st out of 131 countries in the female labour force participation rate, and much worse than many of its neighbours.4 In fact, Sri Lanka’s female labour force participation stabilized at around 35% decades ago, and Bangladesh consistently demonstrates well over 50% female labour force participation.
Most worryingly, India is losing its most educated and productive women.5 National Sample Survey (NSS) data shows that women who have passed higher secondary have the lowest female labour force participation in India.6 This is to say nothing of the ‘marriage penalty’ or ‘child penalty’ for women who drop out of the labour force due to marriage and childbirth. It is increasingly obvious that standard economic theory has it exactly backwards. We can’t wait for incomes to rise: incomes in India will stagnate unless we find ways to get women, especially the most economically productive, back into the labour force.
What can policymakers do to draw women back into the labour force?
Answering this question necessitates a closer look at the data. Recent research shows that the decline in female labour force participation in India is largely due to a drop in women entering the labour force in rural India.7 In plain language, this means that as rural incomes rise, women prefer not to do the backbreaking work of agricultural labour – which is understandable. But even then, there is still significantly greater female labour force participation in rural areas compared to urban areas. In other words, even with rising incomes, women in urban areas are not entering the labour market. The important question is this: why are women refusing or unable to enter the labour force in urban areas, where higher wage and higher skill jobs are available in greater numbers?
The challenges of integrating women into the labour force will only be accentuated as India continues to urbanize. From 2001-2011, the urban population growth rate was 2.4 times that of the rural population growth rate in India, significantly higher than any other decadal urban-rural population growth ratio in the country’s history. We only expect this process to accelerate. India is likely to see its urban population rise from 338 million in 2010 to 875 million in 2050; the increase of 497 million between 2010 and 2050 is the largest projected growth in urban population in world history.
Of course, the country will continue to manifest pernicious patriarchal norms that prevent women from entering the labour force. However, as our data shows, women themselves are quite willing to work – and the men in the household are supportive of it, despite these patriarchal norms. But it is Indian cities that are not hospitable to women entering the labour force. The proximate policy challenge for increasing female labour participation, thus, centres around managing rural-urban transitions and making cities hospitable places for women to work.
Why Are Indian Cities So Inhospitable to Women Wanting to Work?
Our understanding of female labour force participation must necessarily encompass a broad swathe of economic activities and opportunities. Labour force participation may be ‘formal’ or ‘informal’, given that most labour in India is in informal sectors. Labour force participation may also include entrepreneurship activities, from operating stores and food stalls to trading. It has been widely recognized that the role of many women in household duties – and its contribution to household economic productivity and expenditure saving8 – is rarely measured properly. Nonetheless, one must acknowledge the importance of female labour force participation outside the home. The opportunity to engage in economic activity outside the home increases the marginal value of employment, and it is also more likely to break discriminatory gender norms that coerce women to stay at home. Thus, no matter how incomplete the definition, standard measures of female labour force participation are important in and of themselves.
From an economic perspective, a woman’s decision to participate in the workforce is broadly viewed as a consequence of evaluating two trade-offs. First, as aggregate household income increases, the marginal benefit of entering the labour force is thought to decrease; that is, if there is sufficient money in the household, there are weaker incentives to get a job. Second, the incentive to join the labour force decreases as the opportunity costs (psychic or financial) of leaving home increase; that is, if it is particularly difficult to carry out necessary tasks at home while working, an individual would be less likely to work a job outside the home.These economic trade-offs, in turn, interact with urbanization in particular ways to negatively impact opportunities for women to enter the labour force.
In rural India, agricultural work is typically near the home, so there is a natural source for female employment. Even in non-farm work, rural India has demonstrated the capacity to employ women. For instance, more women than men availed of the opportunities provided by the Mahatma Gandhi National Rural Employment Guarantee Act (MGNREGA) – often, small infrastructural work near the village.9
In urban India, on the other hand, such a natural source of women’s employment rarely exists near the home. Industries like construction tend to be less preferred by women and also tend to discriminate against women in hiring. This obliges women in urban India to look far from home for suitable employment. Unfortunately, the lack of safe transport for women to travel significant distances creates obstacles to working outside the immediate locality. If women are unable to procure safe and stable transport to and from a place of work in urban spaces, they are unlikely to enter the labour market, which likely negatively impacts female labour force participation.
These challenges help explain why urban women, among the most skilled in the population, are often missing from the labour market. In principle, more well-off and educated women should be able to command higher wages and better jobs, which would facilitate their entry into the labour force. But availing of these jobs often implies that women have to travel far for a suitable job. Thus, while a section of economists continue to argue that urban Indian women simply choose to stay at home as income rises, the real reason for low urban female labour force participation may well be the increased ‘costs’ of entering the labour market.
A Data-Driven Perspective
While the aggregate data shows a worrying trend of declining female labour force participation, we still lack systematic large-scale data on the labour market behaviour of working-age women. I have been conducting a wide-ranging study of female labour force participation jointly with Apurva Bamezai, Devesh Kapur and Milan Vaishnav. The research is taking place in four cities – Dhanbad, Indore, Patna and Varanasi – and the surrounding peri-urban and rural areas of each city. In each of the four urban areas (and surrounding areas), 3500 households are to be surveyed. In each household, a working-age female and the (usually male) primary wage earner is to be interviewed. This allows us to understand not only women’s own perceptions about the labour market but also possible constraints from men in the household.
Preliminary data from completed surveys in Dhanbad, Patna and Varanasi reveal important trends. In each of these three cities, only 20-30% of working-age women are (or have ever been) in the labour force. This is consistent with the overall national employment numbers described above. If a woman is in the labour force, she is 20 to 30 percentage points more likely to be engaged in agriculture compared to her working male counterpart. This suggests that even when they are able to enter labour force, a disproportionate number of women are engaged in labour near the home.
There is little evidence that women are willingly opting out of the labour force, as posited by the theory of income effects. Among working-age women who have never been employed, we find that 60-70% of women are willing to work if offered a suitable job.10 Somewhat surprisingly, a very similar percentage of male respondents believe that the woman should be allowed to work if offered a suitable job.
In each of these three cities, less than 30% of women feel ‘very safe’ travelling alone at night, compared to more than 40% of men. Our preliminary analyses also indicate that perceptions of easy, safe travel are major determinants of whether a woman is willing to enter the labour force. Taken together, this provides suggestive evidence that the city can be inhospitable to women who are willing to enter the labour force, even if there is support at home.
The Way Forward
Declining female labour force participation is a deeply worrying trend that must be reversed if India is to accelerate its economic development. Strong patriarchal norms still exist in India, but, as discussed here, low female labour force participation is about much more than social conservatism: a prime cause is how Indian cities discourage women from entering the labour force.
Fundamentally, women are not joining the workforce in urban India because urban infrastructure is failing them. The data suggest that there exist both a desire for women to work and support at home for it, provided there is stable and safe transport to and from work. Indeed, recent work by Girija Borker has shown how the safety of the Delhi Metro provided many college-going women the opportunity to attend high-quality colleges far from home.11 A similar principle is likely to encourage greater female labour force participation as well.
But the challenges of each Indian city are unique and context-specific. There are a number of complicated social factors that impact female labour force participation, and it would be foolhardy to generalize too much from the data we have collected. Ultimately, more systematic large-scale data collection on women’s labour choices is required, as this is the only way to identify actionable policies to address India’s low female labour force participation.
Other pieces as part of CPR’s policy document, ‘Policy Challenges – 2019-2024’ can be accessed below:
The Future is Federal: Why Indian Foreign Policy Needs to Leverage its Border States by Nimmi Kurian
Rethinking India’s Approach to International and Domestic Climate Policy by Navroz K Dubash and Lavanya Rajamani
India’s Foreign Policy in an Uncertain World by Shyam Saran
Need for a Comprehensive National Security Strategy by Shyam Saran
A Clarion Call for Just Jobs: Addressing the Nation’s Employment Crisis by Sabina Dewan
Time for Disruptive Foreign and National Security Policies by Bharat Karnad
Multiply Urban ‘Growth Engines’, Encourage Migration to Reboot Economy by Mukta Naik
Schooling is not Learning by Yamini Aiyar
Clearing Our Air of Pollution: A Road Map for the Next Five Years by Santosh Harish, Shibani Ghosh and Navroz K Dubash
Protecting Water while Providing Water to All: Need for Enabling Legislations by Philippe Cullet
Interstate River Water Governance: Shift focus from conflict resolution to enabling cooperation by Srinivas Chokkakula
Managing India-China Relations in a Changing Neighbourhood by Zorawar Daulet Singh
Beyond Poles and Wires: How to Keep the Electrons Flowing? by Ashwini K Swain and Navroz K Dubash
Regulatory Reforms to Address Environmental Non-Compliance by Manju Menon and Kanchi Kohli
The Numbers Game: Suggestions for Improving School Education Data by Kiran Bhatty
Safe and Dignified Sanitation Work: India’s Foremost Sanitation Challenge by Arkaja Singh and Shubhagato Dasgupta
Safeguarding the Fragile Ecology of the Himalayas by Shyam Saran
Towards ‘Cooperative’ Social Policy Financing in India by Avani Kapur
1 International Labour Organization, ‘Key Indicators of the Labour Market Database’, 2016, http://data.worldbank.org/indicator/SL.TLF.CACT.FE.ZS.
2 World Bank, ‘World Development Indicators’, Database, 2015.
3 Stephan Klasen and Janneke Pieters, ‘What Explains the Stagnation of Female Labor Force
Participation in Urban India?’, The World Bank Economic Review 29(3) (2015):449-478.
4 Louis A. Andres, Basab Dasgupta, George Joseph, Vinoj Abraham and Maria Correia, ‘Precarious Drop Reassessing Patterns of Female Labor Force Participation in India’, World Bank Policy Research Paper No. 8024 (World Bank, 2017).
5 It is worth noting that women who are college graduates do show somewhat higher levels of labour force participation. But this is likely explained by the fact that households with the most liberal attitudes towards female work allow their daughters to complete college and not get married as early, and display a host of other factors likely to encourage female labour force participation.
6 Farzana Afridi, Tara Dinkelman and Kanika Mahajan. ‘Why Are Fewer Married Women Joining the Work Force in India? A Decomposition Analysis over Two Decades’, IZA Working Paper No. 9722 (2016).
7 Ibid.
8 Ashwini Deshpande and Naila Kabeer, ‘(In)Visibility, Care and Cultural Barriers: The Size and Shape of Women’s Work in India’, Ashoka University Economics Discussion Paper 04/19. (2019).
9 Economic Survey 2018.
10 This is consistent with recent evidence from the NSS. Erin Fletcher, Rohini Pande and Charity Maria Troyer Moore, ‘Women and Work in India: Descriptive Evidence and a Review of Potential Policies’, HKS Working Paper No. RWP18-004 (2017).
11 Girija Borker, ‘Safety First: Perceived Risk of Street Harassment and Education Choices of Women’, Working Paper, 2018.
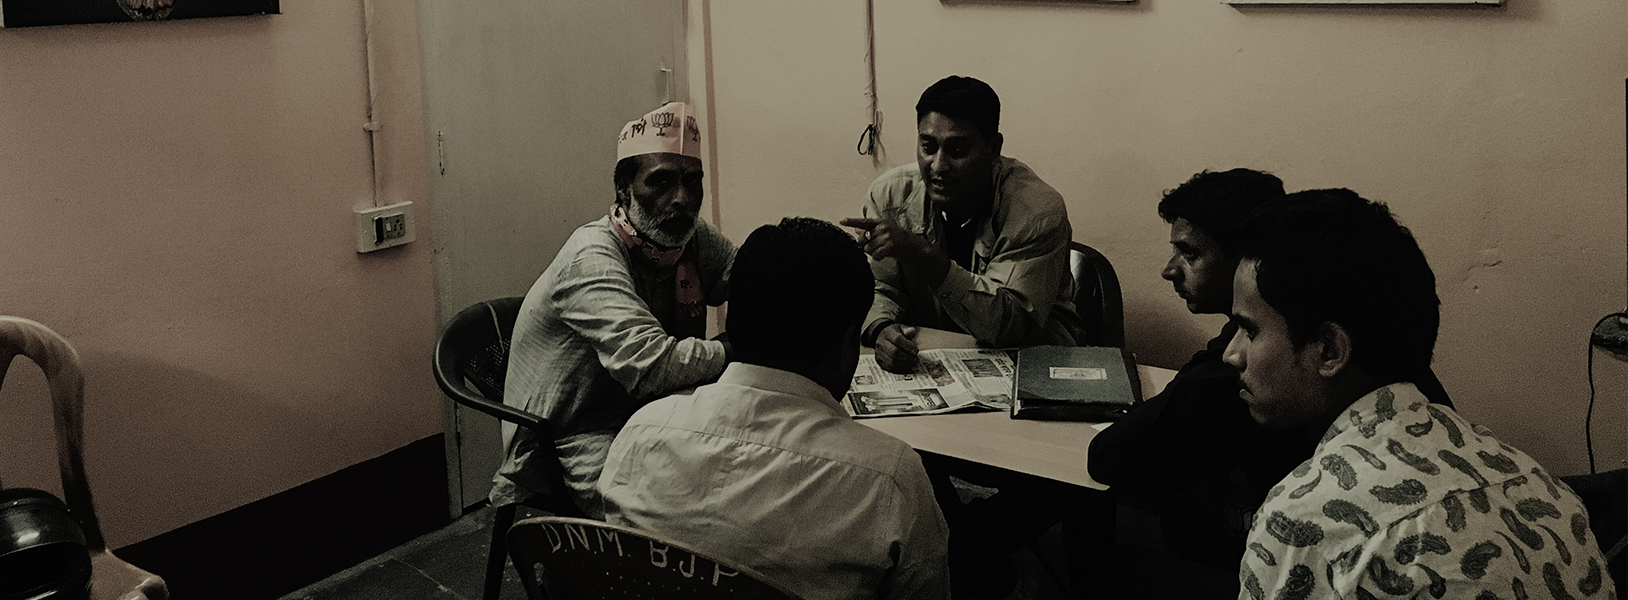
CPR RESEARCHERS ANALYSE THE ASSAM ELECTIONS
ELECTION STUDIES POLITICS
Based on days of field work, CPR researchers Neelanjan Sircar, Bhanu Joshi and Ashish Ranjan share field notes from the regions of Upper Assam and Barak valley, as the state awaits election results, to be announced after a month.
The battle lines are drawn between the BJP and the Congress. And the key question is: ‘Do voters take a chance on a party (BJP) that is promising greener pastures but has the potential to set fire to a social tinderbox, or do voters stick with the safety of a party (Congress) they know inside and out after 15 years of rule?’
There are no easy answers. Particularly so, because Assam is an immensely complicated state comprising regions with vastly different histories and cultures, juxtaposed with what appears to be a unifying desire for growth and development among a number of voters.
This in-depth field analysis unpacks the multiple narratives. Read the full paper here.
Sircar, Joshi and Ranjan will be sharing their next piece on the Lower Assam region.
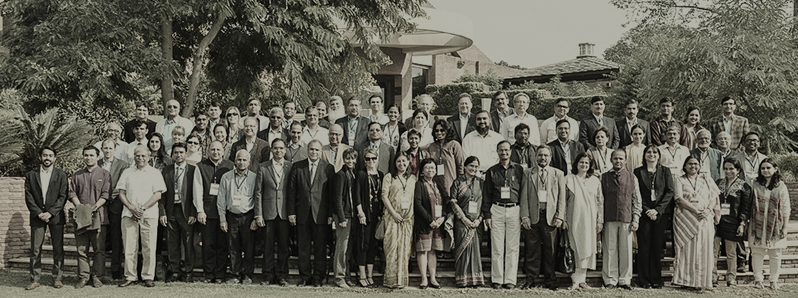
The Centre for Policy Research organised the 5th South Asia Regional Meeting of think tanks supported by the Think Tank Initiative in November, 2015.
A range of topics spanning agriculture, trade and food security in the region; the role think tanks play in influencing policy; climate and environment; addressing issues of poverty and development; and working toward greater South Asian cooperation were deliberated at the meeting. In addition to sharing learning and understanding challenges, think tankers and donors focused on charting the future trajectory, with the aim of continuing to be effective within the South Asian milieu.
Over twenty think tanks; the Canadian High Commission; political representatives from India and Sri Lanka; select media representatives; and donors participated in the meeting.
Provided below are key outputs that emerged from the meeting:
A summary report highlighting the key themes addressed and the recommendations that emerged.
Videos of the following sessions:
Session on Agriculture, Trade and Food Security
Panel on Collaborative Adaptation Research Initiative in Africa and Asia (CARIAA)
Session on Climate and Environment
Session on Poverty, Development, Inclusion and Public Service Delivery
Session on Governance, Urbanisation and Accountability
Special Session on Safe and Inclusive Cities
Key Note Address by Harsha de Silva, Hon. Deputy Foreign Minister, Sri Lanka, on Think Tankers as Policy Makers
Photographs from all days: Day 1 Day 2 Day 3
Presentations by: CSTEP, Harish Damodaran, IPS, CPD
Storified live tweets from the meeting.
The dedicated event page can be visited here.
BY CENTRE FOR POLICY RESEARCH AND JUST JOBS NETWORK
URBANISATION URBAN ECONOMY URBAN SERVICES
The high-pitched debate about data on employment and job creation in India has only served to highlight that the paucity of quality employment is a serious barrier to economic mobility, especially for young people who are moving off the farm. In order to leverage the oft-discussed demographic dividend, however, policymakers need a clear picture of ‘where’ structural transformation is actually happening.
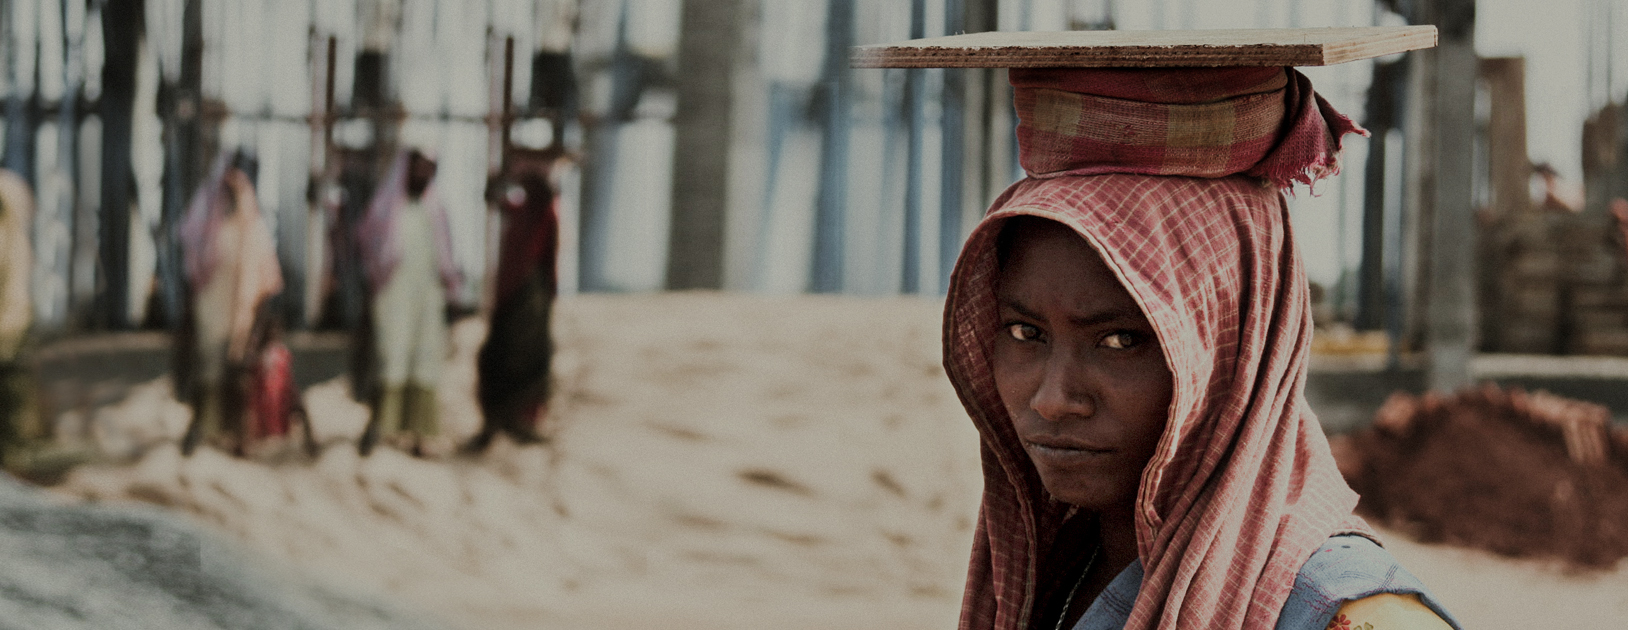
Through this research project titled ‘The role of small cities in shaping employment outcomes for migrant youth’, the Centre for Policy Research and JustJobs Network draw policy attention to the potential of range of non-metropolitan urban locations, including secondary cities, small towns, densifying and urbanising villages and peri-urban spaces – collectively referred to as small cities – to improve employment opportunities for a vast proportion of young people in emerging economies. Using the cases of two cities each in India and Indonesia, the research project has studied the types of mobilities and migration small cities experience, the labour market experiences of youth in these cities, as well as the governance and planning frameworks that address key issues in economic development, employment and migration. Central to the project are the young men and women that have been the subjects of enquiry: their dreams and aspirations and their strategies for navigating pathways towards economic mobility.
Small City Dreaming is a short documentary film that offers a glimpse into the working lives of young people in small cities in India and Indonesia. It explores the connections between villages and small cities through the work journeys of three characters: Oscar in Kupang, in eastern Indonesia; Bhagchand in Kishangarh, Rajasthan, India; and Latifah in Semarang Regency, Central Java, Indonesia. Seeing the small city through their eyes, we learn that even as many young people in small cities remain stuck in dead-end jobs, others use networks and skills learned in the city to become entrepreneurs. The depictions of the daily lives of Oscar, Bhagchand and Latifah and their articulations of their struggles and dreams are intended to urge audiences to move beyond the dominant uni-dimensional imaginations of village-to-metropolis migrations to explore multiple kinds of migrations and mobilities, often across territorial entities that do not neatly fit into our understanding of the ‘village’ and the ‘city’.
STATEMENT
January 17th, 2024
On 10th January 2024, CPR received a notice from the Ministry of Home Affairs cancelling its FCRA status. The basis of this decision is incomprehensible and disproportionate, and some of the reasons given challenge the very basis of the functioning of a research institution. This includes the publication on our website of policy reports emanating from our research being equated with current affairs programming.
During the tenure of our suspension, we sought and obtained interim redress from the honourable Delhi High Court and will continue to seek recourse in all avenues possible.
This cancellation comes after a decision to suspend the FCRA status in February 2023. These actions followed an Income Tax “survey” that took place in September 2022. The actions have had a debilitating impact on the institution’s ability to function by choking all sources of funding. This has undermined the institution’s ability to pursue its well established objective of producing high quality, globally recognised research on policy matters, which it has been recognised for over its 50 years’ existence. During this time the institution has been home to some of the country’s most distinguished academics, diplomats and policymakers.
CPR firmly reiterates that it is in complete compliance with the law, and has been cooperating fully and exhaustively at every step of the process. We remain steadfast in our belief that this matter will be resolved in line with constitutional values and guarantees.