Introduction:
India’s journey towards sustainable mobility is accelerating. Electric three-wheelers (E3Ws) are taking the lead, even in Dhampur, where they have become essential for both employment and local transportation. Conversations with e-rickshaw pullers, manufacturers, and battery dealers give crucial insights into the increasing use of e-rickshaws in small towns, the present battery recycling systems, and the urgent need to advance these efforts. This article briefly highlights these aspects.
The E-Rickshaw Boom
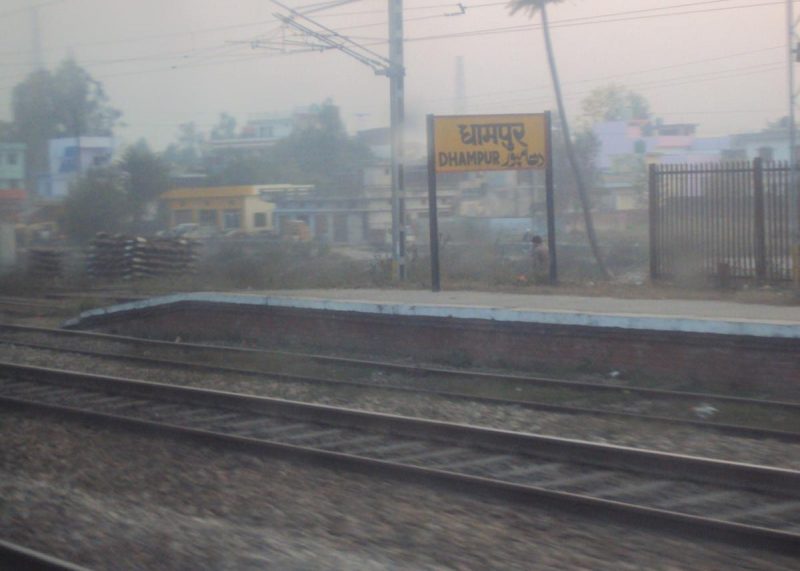
In the small town of Dhampur, Uttar Pradesh, the streets are buzzing with a new kind of energy. Electric rickshaws, often called mini metros, are now a noticeable sight. Katik Ahmed, a 40-year-old entrepreneur from the region embodies the local spirit of innovation. Coming from a humble background, Katik began his career in welding before venturing into the e-rickshaw business in 2010. His company, MK Rana Engineering Works, operates two manufacturing units, selling e-rickshaws for approximately Rs. 1,15,000 each. In the town, these are crucial for daily commute and local businesses, including waste collection by Gram Panchayats. He further informs that there are around 500 e-rickshaws in Dhampur and about 3000-4000 in district Bijnor. As per the data from the Parivahan portal (2024), Bijnor has a total of 3,380 registered e-rickshaws, with 3,355 being passenger vehicles and 25 being e-rickshaws with carts. This transition reflects broader national trends. E-rickshaws, three-wheeled low-speed vehicles powered by a lead-acid or lithium-ion battery have seen rapid growth in the states of Delhi, Uttar Pradesh, Bihar, and other regions, accounting for 91% of all e-three-wheelers (E3Ws) on the road (MoRTH 2023).
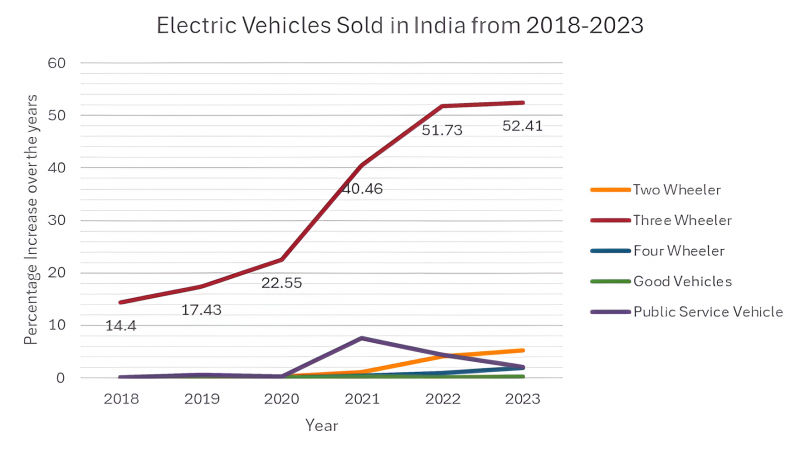
Source: e-Vahan portal, Government of India, 2024
The figure shows a consid00erable increase in the adoption of electric vehicles across several categories in India between 2018 and 2023. The three-wheeler (3EWs) category has witnessed the highest adoption rate (52%) over the years. This comprises both rickshaws and autos. The percentage may be greater considering the high incidence of unregistered vehicles.
The widespread adoption of e-rickshaws, even in small towns like Dhampur, is driven by the socio-economic benefits they provide. E-rickshaws are more cost-effective than ICE-based auto-rickshaws, with a lower initial price (Rs 0.6-1.1 lakh vs. Rs 1.5-3 lakh) and substantially lower operating costs (Rs 0.4/km vs. Rs 2.1-2.3/km) (Dasgupta, 2021). Electric three-wheelers are 13-46 percent cheaper than auto rickshaws, which are currently dependent on rising CNG, diesel, or petrol prices (Harikumar, Anand, Jain, & Phillip, 2021). E-rickshaws also provide drivers with significant improvement in their incomes. Take Ganga Ram Singh, a vegetable vendor in Dhampur who also drives an e-rickshaw. His vehicle has become a reliable source of income, earning him around Rs. 700-800 per day. Similarly, Chandra Prakash Chauhan, another driver found an economic alternative within a local community after being rendered jobless due to drug abuse. Factors such as increased daily trips due to reduced manual energy usage, increased carrying capacity (on average four-seater e-rickshaws), and standard per-trip fare further contribute to these financial gains, making e-rickshaws a more viable choice for unskilled individuals from low-income backgrounds.
Besides, supportive government policies like the National Electric Mobility Mission (2013), National Urban Livelihood Mission (2013), Pradhan Mantri Mudra Yojana (2015), Smart City Mission (2015), Faster Adoption and Manufacturing of Electric Vehicles (FAME I and II) and several Production Linked Incentives (PLIs) have laid a strong foundation.
Current State and Future Demands
While speaking with Katik about electronic waste disposal, he mentioned that the dominant method is selling battery waste materials to battery dealers. An e-rickshaw requires four batteries, each costing approximately ₹8,000. After 15 months of consumption, operators sell discarded batteries to dealers for around ₹2,500. E-rickshaw operators generally charge their vehicles at home, where a 10-hour charge supplies sufficient power to cover approximately 80 kilometres. Battery dealers collect battery trash and provide it to 4-5 scrappers in Dhampur, each receiving around 20 batteries in a month. When interviewed, scrappers reported transferring collected waste, valued at ₹115-₹117 per battery, to registered recyclers in Joya (Amroha) and Bhojpur (Moradabad), with some preferring to send it to Rajasthan recyclers. These facilities sort, shred, smelt, and reuse valuable materials. Components like lead, acid, nickel, plastic, and cadmium are then utilised to manufacture new batteries and other products. However, as the number of electric vehicles on the road continues to rise, concerns will arise regarding the adequacy of the existing battery recycling infrastructure to handle this expansion.
Electric vehicles are expected to account for 39% of total automotive sales by 2027, growing at a compound annual growth rate (CAGR) of approximately 68% over the next 5 years (Indus Law, 2022). Most of the growth is projected to come from the travel segment, in particular E3Ws and E2Ws. This is due to fixed duty cycles and companies (e-commerce, groceries, and shops) committing to go entirely green in the last mile of the delivery processes.
The most recent Battery Recycling Rules, 2022, implemented by the Ministry of Environment, Forest, and Climate Change, aims to improve India’s battery recycling ecosystem. The regulations cover all types of batteries, regardless of their composition or intended use, and hold producers (manufacturers and importers) responsible for the collection and recycling of the batteries they introduce into the market. However, the existing literature points out several challenges: First, the guidelines lack clear criteria for evaluating and classifying used batteries that could still have a second life, such as those suitable for household or backup energy use. Second, there is no mention of labelling to aid in proper segregation and disposal. Third, the rules do not specify incentives for compliance or penalties for non-compliance.
These gaps highlight that, although the current regulations are a positive start, additional improvements are necessary to ensure the success and sustainability of battery recycling in India. It is necessary to compile key data such as the proportion of market share between formal and informal recyclers, the methods employed by informal smelters, and the health risks faced by workers for refining policies. To enhance the recycling ecosystem, the government should prioritise closed-loop recycling, offer incentives for manufacturers to comply with recycling requirements, and work to increase overall recycling rates. Furthermore, promoting recycling-friendly designs and investments in advanced research and technology for better recycling methods will be essential for long-term progress. With the policy framework now established, it is equally important to focus on its effective implementation. A multi-stakeholder approach should be adopted to monitor and refine these rules as needed.
Conclusion
Dhampur’s adoption of electric rickshaws supported by an emerging recycling system, showcases commendable progress toward sustainable mobility. However, existing recycling efforts will be insufficient to manage the increasing battery waste. The faster we understand the challenges and solutions, the quicker we can achieve the goal of sustainable mobility. Addressing these gaps and accelerating recycling efforts are essential for developing a battery recycling ecosystem for the future.